
SLOs and Error Budgets: Best Practices

If I want better service reliability, I need more than dashboards. I need clear SLOs, a fixed error budget, and release rules that teams must follow.
This article boils the work down to a simple system:
- I define SLOs around the user journeys that matter most
- I track a small set of SLIs for availability, latency, and correctness
- I turn each SLO into an error budget, such as the 0.1% failure room behind a 99.9% target
- I use burn-rate alerts and release gates so reliability data changes day-to-day decisions
- I review results weekly, monthly, and quarterly, then run blameless reviews when the budget runs out
A plain example: if a service runs at 100 requests per second over 30 days, it handles about 259,200,000 requests. With a 99.9% SLO, I can spend about 259,200 failed requests before missing the target. That is also about 43 minutes of downtime in the same window.
What matters most is not the math on its own. It is the policy behind it. If budget burn stays low, teams can keep shipping. If burn climbs past set thresholds, I slow changes, limit releases, or freeze them except for fixes.
At a glance, the article shows how to pick SLOs, calculate budgets, wire up telemetry, alert on burn rate, and use review cadences to keep the process tied to release control.
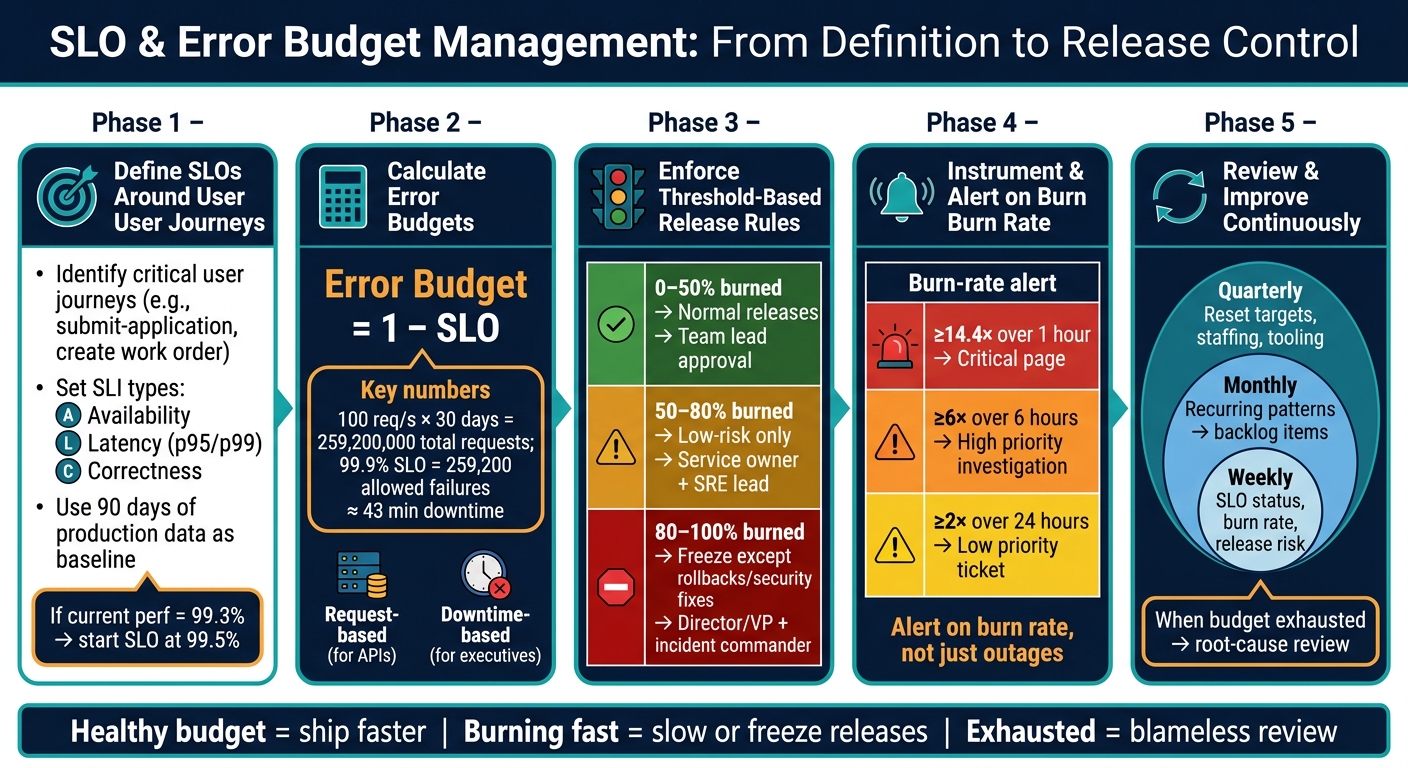
SLO & Error Budget Management: From Definition to Release Control
Checklist: Defining SLOs That Reflect Real User Impact
Identify critical user journeys and service boundaries
Start with the top journeys you identified earlier and use them to define your first SLOs. Put the focus on user-visible workflows with direct business, revenue, or regulatory impact. Leave out internal jobs unless they have a direct effect on a user-facing journey.
Rank those journeys by business impact, then trace the top one to three from end to end. For example, a submit-application journey may run through identity, validation, payment, and storage services. Set the SLO boundary at the external interface, not deep inside internal database work. For each service, document the owning team, dependencies, and completion criteria.
Once that boundary is clear, you can define the SLIs that match it.
Choose SLIs for availability, latency, and correctness
Pick two to four SLIs per journey that line up with what users actually experience:
- Availability: the share of requests that complete successfully under business rules, not just HTTP status.
- Latency: p95 or p99 end-to-end response time measured at the edge or API gateway. Percentiles matter because averages can hide the long delays users feel. A common pattern is p95 ≤ 2.0 seconds for "create work order" over a rolling 30-day window.
- Correctness: the share of automated workflows that end with consistent, valid data.
Measure against real user traffic, and exclude invalid-input errors.
Set realistic targets and review windows
After you’ve chosen your SLIs, set targets that fit both current performance and user expectations.
Use 90 days of production data as your baseline, not a made-up percentage. If your application submission endpoint has delivered 99.3% successful requests over the last 90 days, a sensible starting SLO is 99.5%. That’s better than where you are now, but still within reach without burning through your error budget in the first week. For new services, start at 99.0% to 99.5%.
For measurement windows, rolling 30-day windows work well for most business-critical journeys. Use rolling 7-day windows for high-traffic, consumer-facing services where behaviour changes fast. Use YYYY-MM-DD dates, for example 2026-07-01 to 2026-07-31.
Targets define the budget you’ll govern later.
Use these as starting points:
| SLI Type | Example Target | Window |
|---|---|---|
| Availability | 99.5% successful application submissions | Rolling 30-day |
| Latency (p95) | ≤ 2.0 s for "create work order" | Rolling 30-day |
| Latency (p99) | 99% of requests processed in under 5 seconds | Rolling 7-day |
| Correctness | Data integrity rate for work orders | Rolling 30-day |
Treat these targets as a starting point, not something fixed forever. Revisit them as your services mature and as you get a clearer view of user impact.
sbb-itb-fd1fcab
Checklist: Calculating Error Budgets and Setting Policy Rules
Calculate the budget in requests or downtime
Once you’ve set your SLOs, turn them into something teams can actually spend: an error budget. Put simply, the error budget is the amount of failure you’re allowed before you miss the target. The formula is straightforward: error budget = 1 − SLO.
Take a service that handles 100 requests per second across a 30-day window. That adds up to roughly 259,200,000 total requests. If the service has a 99.9% SLO, that leaves about 259,200 allowed failed requests in that window, or around 43 minutes of allowable downtime.
Both ways of expressing the budget have their place. Request-based budgets tend to work better for API-heavy microservices, where partial failures and retries can make a simple up/down view misleading. Downtime-based numbers are often easier for product owners and executives to work with. Once the budget is stated in plain terms, use it to guide release calls.
Define threshold-based decision rules
A budget number on its own doesn’t do much. You also need clear rules for what happens as that budget gets used up. Burn-rate thresholds are a simple way to trigger release limits and freeze points.
| Error budget burned | Release rule | Approvals required |
|---|---|---|
| 0–50% | Normal releases | Team lead |
| 50–80% | Low-risk releases only | Service owner + SRE lead |
| 80–100% | Freeze except urgent fixes | Director/VP + incident commander |
Keep freeze exceptions tight. In most cases, that means rollbacks, security fixes, and urgent reliability patches only. Write these rules into a short runbook, then surface them in dashboards and change-management tools so no one has to guess. The same thresholds should also feed deployment checks and incident response.
Connect error budgets to release governance
To make the policy stick, tie budget status directly into CI/CD pipelines. Add a pre-deployment check that looks up the affected service’s budget status and blocks a feature release when more than 80% of the budget has been used, unless a senior approver steps in.
That same status should flow into change records too. Each deployment should show the current budget percentage, burn rate, and whether the change followed policy or overrode it. That’s a big deal in regulated sectors such as public sector, energy, and construction, where audit trails and steady change control matter. The burn-rate status should also appear in dashboards and alerts so teams can see the risk before they ship.
Checklist: Instrumentation, Dashboards, and Alerts
Instrument services end to end
Those policy rules only work if every service emits the same telemetry. In plain terms, you need to collect metrics, logs, and traces the same way across every service, environment, and region.
For metrics, track request counts, error counts, and latency percentiles like P95 and P99 at each service boundary and API gateway. Tag each metric with the service name, environment (dev, staging, production), region, and version. That gives you what you need to calculate error budget burn by service and quickly see whether an issue is limited to one Canadian region or hitting users more broadly.
Logs matter too. Use JSON logs with one consistent format, and always include correlation IDs so you can tie a log entry back to a specific request chain. For traces, use distributed tracing standardised with OpenTelemetry and propagate trace IDs and span IDs across every hop, including third-party calls. That way, when an SLO breach happens, you can see which microservice added the latency or triggered the error instead of just seeing the end result.
Bake this into shared service templates and CI/CD checks so new web application development projects ship observable by default.
Build dashboards for SLO status and burn rate
Each service dashboard should show the current SLI, SLO target, remaining budget, and burn rate across 1-hour, 6-hour, 3-day, and 30-day windows.
Different people need different views of the same numbers. On-call engineers need detailed time-series charts, per-service drill-downs, and links to active incidents. Product owners and executives usually need a higher-level snapshot: budget remaining, overall SLO compliance for the current window, and a forecast showing when the budget will run out if the current burn rate stays the same. For Canadian organisations, regional views help show whether one region is causing most of the failures.
Alert on burn rate, not only on outages
Dashboards show what’s happening. Alerts tell people when to act. Raw error-rate or uptime alerts often miss slow burns, and they can page people for short spikes that don’t matter much. Burn-rate alerting fixes both problems by measuring how fast the error budget is being used compared with the allowed rate.
Burn rate = observed error ratio ÷ allowed error ratio. A practical setup is multi-window, multi-burn-rate alerting. Pair a short detection window with a longer confirmation window, then use different thresholds for urgent pages versus lower-priority investigation tickets.
| Burn rate | Window | Severity | Action |
|---|---|---|---|
| ≥ 14.4× | 1 hour | Critical page | Wake on-call engineer immediately |
| ≥ 6× | 6 hours | High priority | Route to the investigation queue, investigate the same day |
| ≥ 2× | 24 hours | Low priority | Create an investigation ticket, address in business hours |
This setup keeps paging for cases where the budget could run out within hours, while slower issues still get logged and fixed without drowning the team in noise.
Checklist: Operating and Improving SLOs Over Time
Review SLOs on weekly, monthly, and quarterly schedules
Once monitoring is in place, set a fixed review cadence to keep your SLOs useful. When dashboards and alerts are live, the next job is simple: turn SLO data into decisions. If reviews happen only now and then, targets can drift away from actual user impact and team priority.
A steady cadence helps teams spot trouble early and act before it turns into a bigger service issue.
- Weekly: Review SLO status, burn rate, and near-term release risk. Flag any service on track to exhaust its budget within seven days.
- Monthly: Review recurring burn patterns and turn repeated failure patterns into backlog items.
- Quarterly: Reset targets and policy based on business priority – revise SLO targets, staffing, and tooling priorities to reflect current service maturity.
Record review milestones and action due dates in YYYY-MM-DD format so planning artefacts stay consistent across departments and vendors.
Run blameless reviews when budgets are exhausted
When the budget is exhausted, shift from status review to root-cause learning. A structured, blameless postmortem keeps the focus on systems and processes, not on blaming a person.
A good review should cover the full story: a precise timeline of events, the exact moment the budget ran out, the burn-rate trend before exhaustion, user impact in concrete terms, contributing changes such as deployments, configuration updates, and feature flags, plus any dependency failures.
Each action item should include a short description, a named owner, and a due date in YYYY-MM-DD format. Add these items straight into your usual project tracking tool so they stay visible during weekly SLO reviews.
Use delivery partners to support reliability operations
Use a delivery partner to put SLO reviews, observability, and change governance into day-to-day practice.
Conclusion: Core Practices for SLO and Error Budget Management
Once your SLOs, budgets, dashboards, and alerts are set up, tie them directly to release decisions. That’s the part that makes the system matter. The flow is simple: define SLOs around user impact, calculate error budgets, instrument services, then enforce policy.
What to put in place first
Start with one or two critical user journeys. For each one, define two to four SLIs that cover availability, latency, and correctness. Turn each target into an error budget, then connect that budget to a release rule. In plain terms, set one threshold that triggers a release review, and another, higher threshold that pauses risky changes.
You’ll also want at least one dashboard for each critical service. It should show SLO attainment, budget remaining, and burn rate. And instead of waiting until the budget is gone, alert on burn rate so teams can react earlier.
How to keep the process useful
The biggest failure mode with SLOs is simple: they become reporting and nothing more. Don’t let that happen. Keep them tied to release governance. If the budget is healthy, teams can ship faster. If the budget is burning fast, slow down or stop non-critical releases.
When an incident eats up a meaningful share of the budget, run a blameless review and use it to decide what to fix next.
Treat SLOs as living controls. Review them often, respond to burn rate, and retire targets that no longer shape decisions.
FAQs
How do I choose my first SLOs?
Start by checking how your system performs today. That gives you a baseline you can compare against later. Look at key metrics like startup time, crash rate, network latency, and how long common user actions take.
Next, zero in on the metrics that matter most in key user journeys, like login or checkout. Numbers tell part of the story, but user feedback fills in the gaps. It helps you spot pain points that dashboards can miss.
It also helps to test your SLOs with one service or one team first. That small pilot lets you learn what works, fix rough edges, and build confidence before rolling things out more broadly.
What is a good starting error budget?
A good starting error budget should come from your current performance baseline. There isn’t one number that works for everyone, so start by defining clear SLIs such as latency or error rates. Then track them the same way over time so you can see what normal system behaviour looks like.
Once you have data you can trust, set an error budget that matches your operational goals and helps you balance innovation with service stability.
When should releases be paused?
Pause releases when automated tests miss quality thresholds. That matters even more when a test can’t reliably stop deployment. In that case, fix the test or remove it before moving ahead.
Pause releases after deployment, too, if monitoring shows regressions. That can include higher latency or more 5xx errors. The same goes for human checkpoints during canary releases. If they spot regressions or vulnerabilities, stop the release.