Edge Architectures for Low-Delay IoT Apps

If you want low delay in IoT, keep urgent work close to the device, not in the cloud. That is the main point.
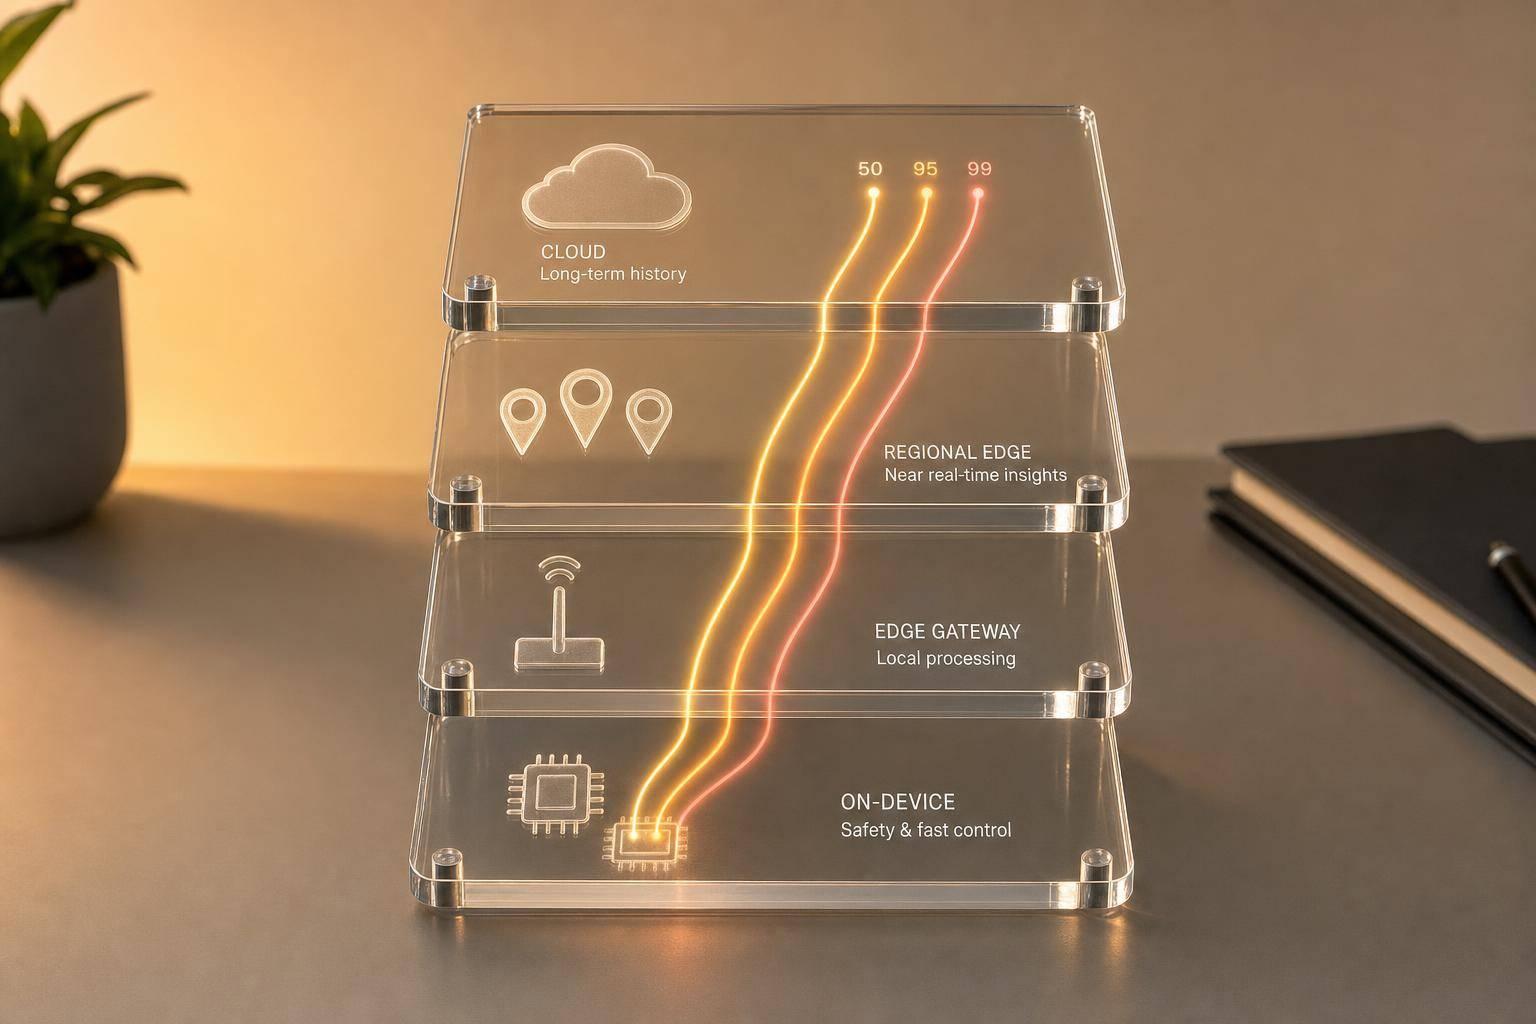
I’d sum the article up like this: put safety and fast control on the device or gateway, use a regional edge only when many sites need shared processing, and leave history, reporting, and model training to the cloud. I’d also track p50, p95, and p99 latency, because average response time can hide slow tail events that hurt users, field staff, or equipment.
Here’s the full idea in plain language:
- I’d split workloads into hard real-time control, near-real-time alerts, and deferred analytics
- I’d use a clear flow: device → gateway → regional edge → cloud
- I’d keep commands separate from telemetry so busy data streams do not delay stop/start actions
- I’d make the gateway handle protocol translation, schema checks, identity checks, local rules, actuator control, and offline buffering
- I’d add a regional edge only if I need cross-site analytics, data residency in Canada, or a buffer during cloud link issues
- I’d design for offline-first use, because remote Canadian sites can lose connectivity for hours or longer
- I’d use event time for reporting windows and processing time for immediate safeguards
- I’d plan for duplicates, out-of-order events, queue limits, replay, and stale commands
- I’d size storage and throughput for peak load and outage recovery, not average traffic
- I’d test failures early: network loss, duplicate delivery, storage fill-up, restarts, and rollback
A few numbers from the article make the point clear:
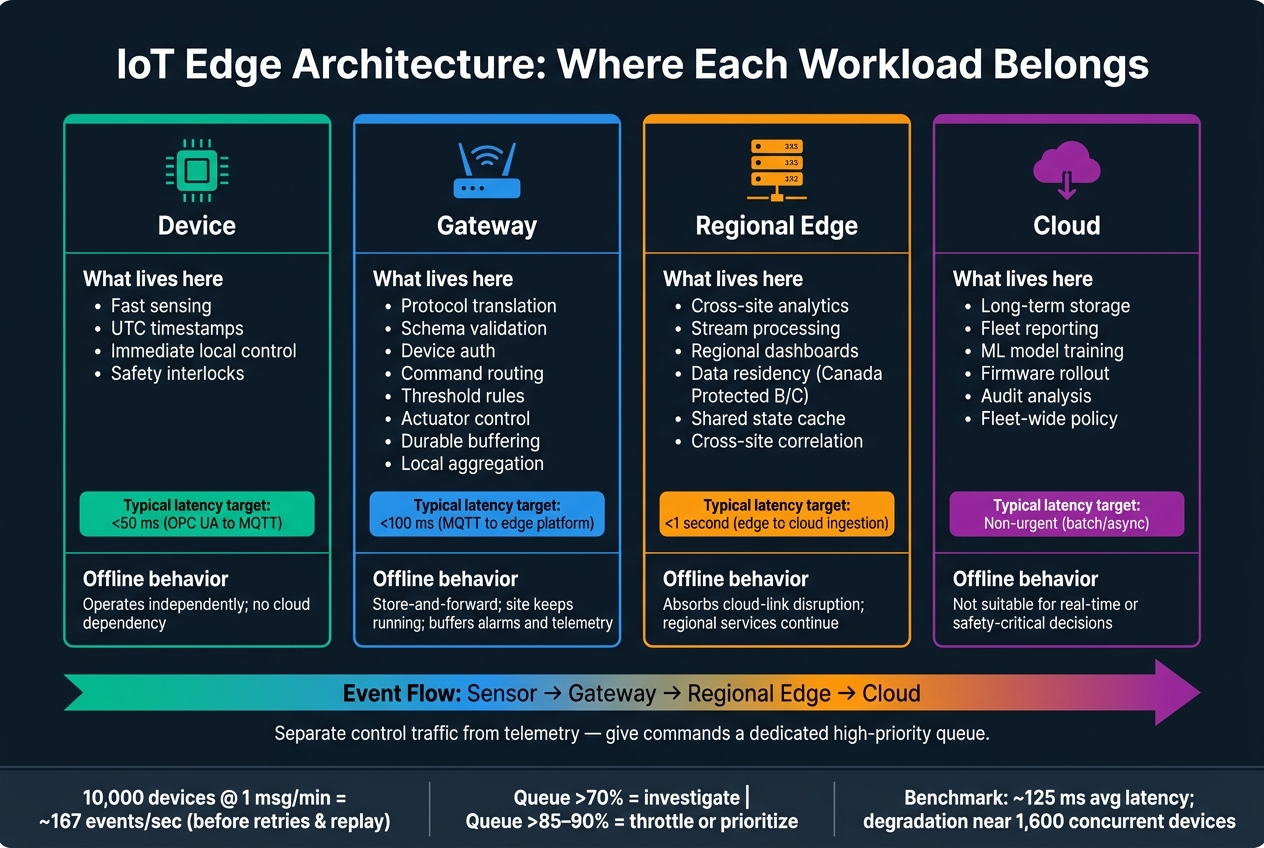
- A fleet of 10,000 devices sending data once per minute creates about 167 events/second before retries and backlog replay
- Queue use above 70% should trigger review
- At 85–90%, I’d start traffic control or prioritisation
- One benchmark cited about 125 ms average latency in tested cases, with slowdown near 1,600 concurrent devices
- Example stage targets mentioned include <100 ms, <50 ms, and <1 second across parts of the path, but those are only reference numbers
IoT Edge Architecture Layers: Device vs Gateway vs Regional Edge vs Cloud
IoT Performance Optimization: Latency, Throughput & Efficiency Techniques
sbb-itb-fd1fcab
Quick comparison
| Layer | What I’d keep there | Why |
|---|---|---|
| Device | Fast sensing, timestamps, immediate control | Lowest delay |
| Gateway | Local rules, command routing, buffering, protocol conversion | Keeps the site running during outages |
| Regional edge | Shared site logic, stream processing, regional dashboards | Helps multi-site fleets and Canadian data location needs |
| Cloud | Long-term storage, fleet reporting, training, update rollout | Best for non-urgent work |
So, before I pick any pattern, I’d define the delay budget, offline window, replay rules, and failure response. That choice drives the whole design more than any one product does.
Map the Device-to-Gateway Path
The device-to-gateway path is the first and most time-sensitive layer in an IoT architecture. In practice, the flow looks like this: sensor or actuator → local network → gateway ingestion → validation and local control → queued telemetry/control → regional edge or cloud. That path shows exactly where delay can creep in, and just as important, what still has to work when the connection drops. In plain terms, it sets the line for what the gateway must handle on-site.
One design choice matters a lot: separate control traffic from telemetry. If a surge of sensor data hits a shared queue, it can hold up an urgent command like an emergency valve closure. That’s the kind of delay you don’t want. Give commands their own high-priority topic or queue, with bounded retries, strict authorisation, and clear acknowledgement. Telemetry has more room to breathe, so it can use batching, compression, and lower priority.
What the Gateway Must Handle Locally
A gateway is not just a bridge between networks. It’s the working layer on-site. At a minimum, it should handle protocol translation, schema validation, device authentication, command routing, threshold rules, safety interlocks, and durable buffering during connectivity loss. That also includes actuator control, local aggregation, and short-term retry handling. These jobs cut round trips, reduce bandwidth use, and help the site keep running during outages.
Take a water-treatment site in northern Canada. The gateway might check chlorine and pressure readings in kPa and L/min, reject an out-of-range value like a temperature reading of 350 °C from a refrigeration sensor, and shut down a pump locally before any message ever reaches the cloud. It can also buffer alarms and acknowledgements for immediate retry, while holding routine telemetry for later transfer in batches.
Use one standard message envelope for everything that leaves the gateway. Include:
- device ID
- gateway ID
- event timestamp with UTC offset
- ingestion time
- schema version
- sequence number
- quality flag
- units
- correlation ID
This keeps downstream processing predictable and makes traceability much easier. For local storage, size it around your longest expected outage window, message rate, average payload size, and a safety margin on top. Azure’s IoT Edge guidance recommends increasing message time-to-live and disk capacity for sites expected to stay disconnected for extended periods.
Direct Device-to-Cloud vs. Direct Device-to-Gateway
Direct device-to-cloud connectivity can work well for small, uniform fleets with reliable networks and limited local-processing needs. Each device manages its own cloud credentials, certificates, buffering, and software updates. That setup is simple enough at first. But once you add legacy protocols, spotty connectivity, or any need for local control, it starts to get messy.
The table below helps map the two deployment shapes to the site.
| Criterion | Direct Device-to-Cloud | Device-to-Gateway |
|---|---|---|
| Latency | Depends on WAN quality; not a good fit for consistently local response | Local decisions avoid WAN round trips and stay available during outages |
| Bandwidth use | Each device sends its own traffic, including repeated protocol overhead | Gateway filters, aggregates, compresses, and forwards only useful data |
| Offline tolerance | Each device must independently buffer data and decide how to operate offline | Gateway provides shared store-and-forward and local authentication during outages |
| Protocol support | Every device must support the cloud-facing protocol or a device-side adapter | Gateway translates industrial, serial, wireless, and proprietary protocols into a common interface |
| Security boundary | Cloud credentials and updates must be managed across every device | Gateway centralises the upstream security boundary but becomes a high-value target requiring hardening |
| Fleet management | Simpler topology, but many direct connections and software versions to track | Fewer upstream connections; gateway lifecycle adds its own operational responsibilities |
| Failure impact | A device failure is usually isolated | A gateway failure can affect many devices, so redundancy is required |
| Best fit | Small fleets with stable connectivity and limited local control | Industrial, remote, safety-sensitive, or mixed-protocol sites |
For many Canadian industrial and infrastructure projects – remote energy assets, water systems, and construction sites – the device-to-gateway pattern is often the better fit. The gateway becomes the local boundary for security, protocol handling, and resilience, while the cloud takes on fleet-wide analytics and model improvement.
Once the gateway can filter, buffer, and act locally, the next step is deciding what belongs in a regional edge layer. Then the question shifts: should shared analytics and coordination stay on-site, or move up one layer?
Add a Regional Edge Layer and Build the Real-Time Stream Path
Once the gateway is handling local control, add a regional edge only when local decisions stop being enough.
A regional edge extends gateway control across sites. It pulls in telemetry from many gateways, normalises it, runs shared rules and rolling aggregations, and caches operating state for regional dashboards. In practice, the regional edge sits between site gateways and the cloud. It buffers shared regional state, softens cloud-link disruption, and gives you a clear place to meet data-residency needs.
That matters in Canada. Government of Canada rules state that sensitive data classified as Protected B, Protected C, or Classified must be stored in approved facilities within Canada. So compliance can be one very practical reason to place a regional node in an approved Canadian facility.
That said, a regional layer isn’t free. It adds deployment, monitoring, updates, and failover work. Bring it in only when the upside – latency, resilience, sovereignty, or processing headroom – beats that added load.
Gateway-Only, Gateway Plus Regional Edge, or Full Edge Plus Cloud: How to Choose
Pick the smallest topology that covers your needs for distance, reliability, processing, sovereignty, and upstream cost. In plain terms: don’t build three layers when one or two will do.
| Architecture | Suitable use cases | Typical latency and resilience | Operational overhead | Scaling characteristics |
|---|---|---|---|---|
| Gateway-only | Single facility, local automation, small or moderate device fleet, simple rules | Lowest local response time; continues operating if isolated, but has limited cross-site resilience | Lowest; software and hardware are managed per site | Scales by adding or upgrading gateways; duplicated logic can become difficult to maintain |
| Gateway plus regional edge | Multiple facilities, regional operations, shared dashboards, local data-residency requirements, heavier stream processing | Low local latency plus regional coordination; regional services can continue during cloud disruption | Moderate; requires regional deployment, monitoring, security, and failover planning | Scales by site groups and regions; reduces duplicated processing at individual gateways |
| Full edge plus cloud | Large distributed fleets, advanced analytics, centralized management, machine learning, long-term historical analysis | Fast control decisions at the edge; cloud supports fleet-wide functions but is not required for every real-time action | Highest; requires lifecycle management across gateways, regional nodes, and cloud services | Supports broad geographic growth, but requires capacity planning, partitioning, replication, and cost controls |
A simple rule works well here:
- Keep safety-critical or sub-second control loops at the gateway or regional edge
- Put shared regional decisions in the regional layer
- Send durable history and non-urgent analytics to the cloud
Design the Low-Delay Stream-Processing Sequence
Once the regional layer is in place, define how events move through the stream. Validate at ingress, and keep business rules at the lowest layer that has enough context. Don’t push decisions upstream just because cloud compute is available.
A practical flow looks like this: ingest → authenticate and validate → deduplicate → enrich → filter → aggregate → detect and classify → route → acknowledge and observe.
Use event time for physical measurements and reporting windows. Use processing time for immediate safeguards. If events arrive within the grace period, they can still update the window. For late arrivals, set a bounded grace period. For example, use 30 seconds for a vibration alert and 10 minutes for low-priority energy reporting. Anything that shows up after that window should go to a correction or late-data stream, not quietly rewrite finalised results.
Devices should sync clocks with a managed time source, but the system still needs to tolerate clock drift. That part matters more than teams sometimes think. Clocks drift, links flap, and messages arrive out of order. If the design assumes perfect time, it’ll crack the first time a remote site has a rough day.
The same mindset applies to duplicates. Retries, reconnects, and replay all mean the same message can arrive more than once. Give each event a stable ID, and make consumers idempotent. For actuator commands, pair device_id + command_id with expiry, allowed state transitions, and confirmation.
Microsoft’s industrial IoT reference material reports indicative stage-level latencies of less than 100 ms from PLC to OPC UA, less than 50 ms from OPC UA to MQTT, less than 100 ms from MQTT to the edge platform, and less than 1 second from edge to Event Hubs. Those numbers are benchmarks, not promises. Actual performance depends on hardware, network conditions, payload size, partitioning, and workload.
Teams should measure p95 and p99 latency under conditions that match Canadian deployments: rural connectivity, intermittent cellular or satellite links, winter power interruptions, and multiple time zones. A setup that looks fine in a lab in Toronto may behave very differently at a remote site in Northern Ontario or across Prairie routes in mid-winter.
The table below shows where each processing function fits across the three layers.
| Processing function | Gateway | Regional edge | Cloud |
|---|---|---|---|
| Device authentication and basic schema validation | Primary location; rejects malformed or unauthorized data early | Revalidates trust boundaries and shared schemas | Performs fleet-level policy checks and audit analysis |
| Noise filtering and simple threshold rules | Best for immediate local response | Runs shared regional rules and cross-site correlation | Usually unsuitable for urgent decisions |
| Asset and site enrichment | Adds local device metadata | Adds regional context, work orders, weather, and cross-site state | Adds enterprise, financial, and historical context |
| Rolling window aggregations | Handles simple per-device windows | Handles cross-device and cross-site windows | Handles longer historical windows and large-scale analytics |
| Actuator routing | Preferred for local control | Appropriate for coordinated regional commands | Reserved for non-urgent or supervised commands |
| Operational cache | Maintains local state needed during disconnection | Provides shared regional state and dashboards | Stores durable history and centralised views |
| Heavy analytics and model training | Usually constrained by resources | Runs selected inference or regional models | Best for fleet-wide analytics, training, and long-term storage |
| Backpressure and buffering | Protects devices and local links | Absorbs site bursts and cloud outages | Handles durable ingestion, replay, and broad-scale processing |
Make backpressure explicit at every layer. Protect control traffic, put firm limits on queues, and spill non-critical data to durable storage. Never drop safety-critical events without an auditable policy.
Handle Events, Data Sync, and Disconnected Operation
Canada’s rural connectivity gaps make offline-first IoT design a hard requirement, not a nice-to-have. If you’re building IoT systems for mining, energy, agriculture, or public-sector sites, you have to assume the connection will drop. When that happens, the system still needs to run.
Choose the Right Event and Synchronization Model
Start by sorting messages based on urgency and whether they need replay later. A simple way to think about it is through four paths:
- Local-only control events that never leave the gateway
- Priority events like alarms and safety triggers that should go out as soon as a link is up
- Compressed telemetry batches for routine readings
- Periodic state reconciliation for config and operating records
When connectivity fails, backpressure doesn’t disappear. It turns into offline replay. The gateway should write critical events to a local queue, keep processing while offline, and send the backlog once the connection comes back. MQTT persistent sessions help here by keeping subscriptions and delivering unacknowledged QoS 1 messages after reconnection. That said, broker limits differ. You need to test queue depth and replay rate against the load at the site.
Safety logic can’t wait for the cloud. Emergency stops and safety interlocks need local validation, acknowledgement, and rejection if a message is stale or out of sequence. Operational commands should use expiry and idempotency keys. Non-critical config changes can wait a bit. No matter which protocol you use, the command handler needs to stay idempotent. If the same command ID is processed twice, it must not trigger two physical actions.
For low-priority readings, batch them by time window, device group, or payload size, then compress before sending. Keep the metadata that tells the full story: event timestamps, device IDs, sequence numbers, schema versions, quality flags, and gateway receipt times. Without that, downstream systems can’t tell delayed data from brand-new data. You also need clear limits for maximum age, storage capacity, and overflow handling. In practice, the overflow policy should protect alarms, commands, audit records, and state transitions first.
That delivery setup drives the consistency rule.
Match Consistency Level to Risk and Business Impact
Pick consistency based on safety and business impact. Strong or synchronous consistency fits safety-critical commands, access control, financial transactions, and any change that could put equipment into an unsafe state. Eventual consistency is usually enough for dashboards, asset locations, energy summaries, and non-critical telemetry.
Once the delivery pattern is set, match consistency to operating risk. The table below shows how the four sync models compare for low-delay IoT fleets.
| Model | Delay | Offline behaviour | Delivery guarantees | Implementation complexity |
|---|---|---|---|---|
| Synchronous request-response | Highest and dependent on network round trips | Usually unavailable unless a local fallback exists | Can provide explicit acknowledgement and transaction status | High for retries, timeouts, failover, and distributed transactions |
| Asynchronous events | Low for local consumers and decoupled services | Events can be queued or lost depending on broker and policy | At-most-once, at-least-once, or stronger guarantees depending on implementation | Moderate; requires idempotency, ordering, and failure handling |
| Store-and-forward queues | Low locally; upstream delivery is delayed during outages | Strong offline support when the queue is durable and bounded | Typically at-least-once with acknowledgements; duplicates must be handled | Moderate to high; requires persistence, replay, back-pressure, and retention policies |
| Periodic state reconciliation | Immediate local updates, delayed cross-site convergence | Designed for offline operation | Converges according to merge and conflict rules rather than per-event delivery | High when conflicts, versions, permissions, and audit requirements are complex |
After an offline stretch, conflict handling needs care. Use field-level merge rules where that’s safe. Use last-writer-wins only for low-risk preferences. For operating settings, manual review or domain-specific conflict handling is often the safer choice. And commands shouldn’t be replayed blindly after expiry. The gateway should first check that the target condition still exists and that the command is still authorised before doing anything. Audit records should log the initiator, authorisation context, device and gateway identity, timestamps, command ID, outcome, and the reason a command was rejected.
Plan for Scale, Operations, and Custom Delivery
Capacity Planning and Observability for Distributed IoT Fleets
Once the topology is set, size it for peak load and recovery, not average traffic.
Low-delay IoT scaling is about more than device count. You need to model device count, event rate, payload size, site count, command load, retention, sync cadence, firmware cadence, and offline ratio. A fleet of 10,000 devices reporting once per minute generates about 167 events per second before retries, heartbeats, commands, and outage-recovery backlogs are added in. That’s why gateways and regional services should be sized for peak traffic, not the calm middle of the day.
Benchmarks make this pretty clear. One AWS study reported an average latency of about 125 ms across the scenarios it tested, with performance dropping off around 1,600 concurrent devices. Those numbers are only examples, not hard limits. Still, they show why concurrency testing matters. A single-device test can look fine while the full fleet tells a very different story.
Observability also needs to cover the whole path, from device to cloud. If you only watch one segment, you can miss where delay is building.
| Dimension | What to measure | Why it matters |
|---|---|---|
| Latency | p50, p95, p99 end-to-end; per segment | Tail latency exposes congestion that averages hide |
| Event rate | Average, peak, post-outage burst per site | Sizes brokers, queues, processors, and network links |
| Queue health | Depth, oldest-event age, dropped and retried messages | Shows whether the system is keeping pace |
| Availability | Gateway uptime, broker reachability, site-specific status | Distributed failures are often regional, not global |
| Synchronisation | Lag, conflict count, replay volume, last-sync time | Confirms that disconnected sites are converging safely |
| Resource saturation | CPU, memory, disk, network, broker connections | Alerts should precede degradation, not follow it |
Set thresholds before production. Sustained queue use above 70% should trigger investigation. At 85–90%, it’s time to consider admission control or payload prioritisation. Watch event age along with throughput too. A processor can look busy and healthy on paper while a growing backlog means the data is becoming stale for operations.
These metrics then become the acceptance criteria for both implementation and day-to-day operations.
Apply the Architecture in Custom Software Delivery
Use the same layer-by-layer logic during delivery: device, gateway, regional edge, then cloud.
Build in small steps, and give each step clear acceptance criteria. Start with the latency budget, then split it across sensing, network transfer, gateway processing, regional processing, cloud services, and acknowledgement. After that, sort workloads by urgency.
A practical build sequence usually looks like this:
- Build device-to-gateway first
- Add buffering and local rules
- Add regional stream processing
- Add cloud analytics
- Test recovery at every stage
Recovery testing can’t be an afterthought. Simulate network loss, restart, duplicate delivery, storage exhaustion, and bad firmware rollback before calling any layer production-ready. If it only works on a clean path, it’s not ready.
What keeps this kind of system maintainable as the fleet grows is a clean split between shared platform functions and sector-specific logic. Platform capabilities can be reused across projects: device provisioning, certificate rotation, secure communication, gateway registration, local buffering, rules deployment, observability, fleet management, software updates, and synchronisation. Domain modules hold the rules that belong to the sector itself, such as energy-load control, construction-equipment telemetry, logistics temperature thresholds, healthcare workflow rules, or public-service asset monitoring. That split lets business rules change without forcing changes to the edge base.
For teams building this architecture as custom software, the delivery model matters just as much as the design.
Digital Fractal Technologies Inc fits teams that need a custom edge-connected application. A sensible approach is to begin with discovery and architecture definition: document latency budgets, workload classes, data contracts, compliance constraints, failure modes, and fleet-growth assumptions. Then deliver a thin vertical slice before expanding to more sites and device types. Judge the engagement by measured outcomes: lower p99 delay, higher gateway availability, shorter synchronisation recovery, fewer dropped events, and safer or more efficient field operations.
Conclusion: Key Decisions That Cut Delay Without Losing Resilience
The right pattern is the smallest one that meets latency, resilience, and compliance targets. Keep urgent control close to devices. Add layers only when testing shows a clear gain. Define synchronisation rules, failure domains, and recovery objectives before the first outage, not after. The main trade-off is always delay versus resilience versus compliance, and the architecture that wins is the one sized for peak and recovery conditions, not nominal traffic.
FAQs
When do I need a gateway instead of direct device-to-cloud?
Use a gateway when you need centralized management, tighter security, or steadier performance in rough network conditions. It also matters for legacy integrations and regulated workflows with strict compliance and data governance needs.
A gateway is especially helpful for remote field operations with spotty connectivity, where local processing or offline support helps keep things running. It can also handle protocol translation, connection pooling, caching, and request aggregation.
How do I decide if a regional edge layer is worth adding?
Add a regional edge layer when you need millisecond-level response times, local processing for sensitive data, data sovereignty, or steady operation in remote areas with patchy internet.
It can cut lag, help with compliance, and keep systems running when connectivity is limited. Digital Fractal Technologies Inc can help assess whether it aligns with your scalability and governance goals.
What should I measure to prove my IoT app is truly low-delay?
Measure actual responsiveness, not just CPU use. CPU charts can look fine while users still feel delays, so the numbers that matter most are request rate and latency percentiles like p50, p90, and p99. Those show what people are experiencing, from the common case to the rough edges.
You should also track the rest of the path, not just the model itself:
- Queue length
- Consumer lag
- Enqueue and dequeue rates
- Inference latency
- Memory bandwidth
Record latency in milliseconds and use consistent ISO 8601 timestamps across all metrics. That keeps your data lined up and makes troubleshooting much less of a headache.
It also helps to set clear SLOs. For example, you might define a target like p95 latency under 250 ms.