
90–120 Day Pilot Plan for Asset Integrity Analytics for Operators

Asset integrity analytics turns inspection reports, sensor telemetry, and maintenance history into ranked, actionable risk scores that tell engineering teams which assets to inspect next and which can wait. The immediate payoff is fewer surprise shutdowns and inspection budgets spent where they matter most. Digital twins, IoT sensors, and AI models make it possible, but the real starting point is a data readiness audit, not a software purchase.
TL;DR:
- Ensuring data consistency across asset registries, CMMS, and sensor systems is critical before deploying analytics; mismatched IDs and units can invalidate results.
- Focusing on a single asset class and conducting a thorough data audit accelerates value realization and prevents scope creep that delays ROI.
- Combining predictive models, anomaly detection, and prescriptive outputs enables more targeted inspections, better failure forecasts, and cost savings.
- Proper cybersecurity and OT/IT integration measures are essential to protect assets and ensure reliable data flow in asset integrity programs.
- Starting with a scoped pilot and validating KPIs like downtime reduction and inspection efficiency builds trust and smoother scaling in asset management initiatives.
Table of Contents
- Why Asset Integrity Analytics Matters to Modern AIM
- What Core Technologies Actually Contribute
- How Should You Structure Data and System Integration?
- What Outputs Should You Expect from Analytics Models?
- How Do You Implement This Without a Multi-Year Project?
- Which Standards Govern Asset Integrity Analytics?
- What Actually Goes Wrong When Companies Try This?
- How Do You Handle IT/OT Integration and Cybersecurity?
- The Gap Between Analytics Ambition and Analytics Reality
- How Digitalfractal Helps You Move from Pilot to Production
- Sources
- FAQ
Why Asset Integrity Analytics Matters to Modern AIM
Asset integrity management (AIM) has always relied on inspection schedules and engineering judgment. Analytics adds a layer that catches problems those methods miss. When you combine historian data, inspection records, and sensor feeds, you can spot a corrosion trend six months before it would show up on a routine walk down.
The outcomes show up in three places: uptime, maintenance spend, and inspection efficiency. Asset performance monitoring built on continuous data lets teams shift from calendar-based inspections to condition-based ones, which usually means fewer intrusive inspections on healthy assets and more attention on the ones actually degrading. Technologies such as digital twins, IoT sensors, and APM platforms enable real-time condition monitoring that reduces unplanned downtime and optimizes inspection planning.
Common use cases include:
- Predictive maintenance on rotating equipment, using vibration and temperature trends to forecast bearing or seal failure.
- Corrosion monitoring on pipelines and pressure vessels, tying wall-thickness readings to process conditions.
- Anomaly detection across sensor networks, flagging deviations before they become failures.
- Risk-based inspection (RBI) optimization, where analytics reprioritizes inspection intervals based on actual degradation rates rather than fixed schedules.
Pro Tip: Start ROI conversations with maintenance cost per asset, not just downtime avoided. Downtime numbers are harder to defend to finance teams than a clear before-and-after on labor and parts spend. A well-scoped predictive maintenance strategy can show measurable savings within a single fiscal quarter when the pilot is scoped tightly enough.
What Core Technologies Actually Contribute
Vendor pitches tend to blur digital twins, IoT, and APM together as one thing. They are not. Each does a distinct job, and understanding the difference matters when you are deciding what to build first.
Digital twins model an asset’s physical behavior and current condition against its design baseline. A good twin produces a contextualized health score and lets engineers run what-if scenarios, like simulating how a pump would respond to running 15% above rated flow. It is a simulation and visualization layer, not a data collection tool on its own.
IoT and sensors are the collection layer. Vibration, temperature, pressure, and acoustic sensors generate telemetry at sampling rates ranging from once a minute to thousands of times per second. Edge preprocessing matters here: pushing raw high-frequency vibration data to the cloud is expensive and often unnecessary, so most mature deployments filter and summarize at the edge before transmitting.
APM (Asset Performance Management) platforms sit on top of the data layer, running the machine learning pipelines that turn telemetry into predictions and prescriptive actions. AVEVA’s asset performance management approach, for example, positions continuous condition monitoring and predictive analytics as core functions rather than add-ons.
Where you run the compute depends on latency and cost tolerance:
- Edge processing suits high-frequency vibration or acoustic monitoring where a delayed alert is useless.
- Cloud processing suits fleet-wide trend analysis, model retraining, and cross-asset benchmarking.
- Hybrid architectures are the practical default for most operators: edge for immediate anomaly flags, cloud for the deeper degradation modeling that needs history across hundreds of assets.
How Should You Structure Data and System Integration?
Analytics is only as good as the data underneath it, and most AIM analytics projects fail not because the algorithms are wrong but because the data feeding them is inconsistent. A canonical asset registry, one authoritative list of every asset with a consistent ID scheme, is the foundation everything else depends on. Without it, you end up reconciling five spreadsheets every time someone asks a simple reporting question.
The main data sources feeding an integrity analytics program are:
- Inspection reports — often unstructured PDFs that need parsing before they’re usable.
- In-line inspection (ILI) data — pipeline wall-thickness and defect measurements from smart pigs.
- Historian and PLC data — high-frequency process variables like pressure, flow, and temperature.
- CMMS/EAM records — work order history, failure codes, and maintenance logs.
Integration problems are predictable. Timestamps arrive in different time zones. Units get mixed (psi versus kPa, imperial versus metric wall thickness). Asset metadata drifts between the CMMS and the historian because nobody enforced a shared naming convention. Fixing these before modeling starts is unglamorous work, but it determines whether the analytics output is trustworthy.
Pro Tip: Before evaluating any analytics vendor, run a two-week data audit that just checks whether your asset IDs match across CMMS, historian, and inspection systems. If they don’t, that’s your first project, not the predictive model.
On architecture, streaming integration (via message queues or APIs) suits real-time anomaly detection, while batch integration works fine for weekly RBI recalculations. Choosing the right CMMS integration approach early avoids rebuilding pipelines twice.
What Outputs Should You Expect from Analytics Models?
Analytics in AIM breaks down into three functional categories, and knowing which one you’re looking at changes how you interpret the output.
Predictive models forecast time to failure using supervised learning trained on historical failure data alongside process variables. Survival analysis, a statistical technique originally used in medical research, works well here because it handles “censored” data, assets that haven’t failed yet, gracefully. Industrial AI that pairs process-awareness (temperature, pressure, flow) with historical failure data produces more reliable predictions than models built on failure history alone.
Anomaly detection uses unsupervised methods, flagging readings that deviate from normal operating patterns without needing labeled failure examples. The persistent challenge is false positives. A poorly tuned threshold generates alert fatigue fast, and engineers start ignoring the system within weeks. Reducing false positives usually means blending statistical thresholds with domain rules rather than relying on a single model.
Prescriptive outputs are what most integrity teams actually want: a ranked inspection list telling them which ten assets need attention this quarter, plus a recommended inspection interval for each. This is where analytics feeds directly into RBI scoring, replacing static risk matrices with dynamic scores that update as new data comes in.
Key outputs to expect from a maturing program:
- Ranked, risk-weighted inspection queues
- Degradation-rate forecasts per asset class
- Recommended inspection interval adjustments
- Confidence intervals attached to every prediction, not just a single number
How Do You Implement This Without a Multi-Year Project?
The sequence that works, repeatedly, is narrow: pick one asset class, audit the data, run a pilot, validate it, then scale. Trying to roll out analytics across an entire facility at once is the single most common reason these programs stall.
- Select a priority asset class — pick something with a clear failure history and available sensor data, like a specific pump fleet or a pipeline segment.
- Run a data readiness audit — confirm the registry, CMMS, and historian data align before writing a line of model code.
- Build and run a pilot — 90 to 120 days is realistic for a first predictive model on a well-scoped asset group.
- Validate against KPIs — unplanned downtime reduction, inspection efficiency, and model precision against actual outcomes.
- Scale to adjacent asset classes — reusing the same data pipeline and governance structure.
Governance matters more than most teams expect. Every model prediction that changes an inspection interval needs engineering sign-off and an audit trail, especially in regulated environments. Modular suites that centralize inspection workflows, anomaly tracking, and predictive analytics make phased rollouts easier because teams don’t have to commit to enterprise-wide deployment before proving value.
Pro Tip: Assign a subject matter expert from operations, not just IT, to review every model recommendation during the pilot phase. Analytics that engineers don’t trust gets ignored, no matter how accurate it is.
Track four KPIs from day one: unplanned downtime hours, inspection efficiency (assets inspected per dollar spent), maintenance cost per asset, and model precision (how often the ranked list actually matched real degradation). Starting with priority assets and proving results before expanding enterprise-wide consistently produces faster, more defensible ROI than a big-bang rollout.
Which Standards Govern Asset Integrity Analytics?
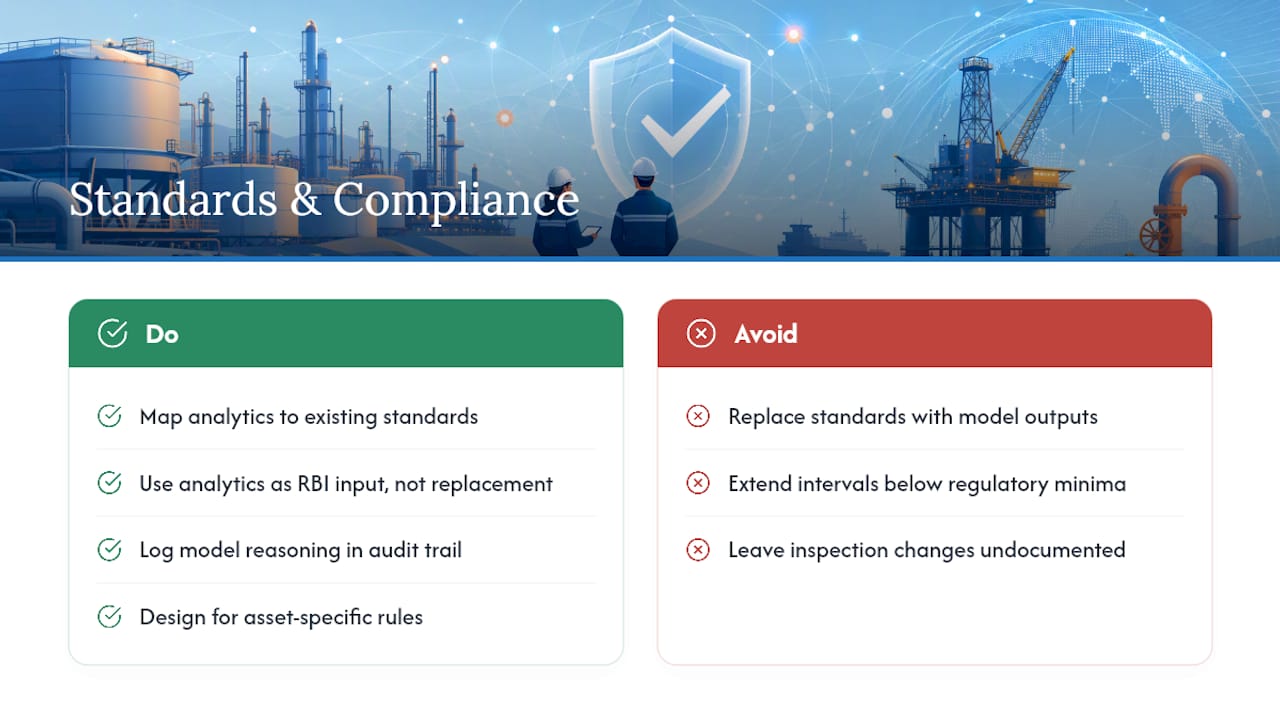
Analytics doesn’t replace the standards your integrity program already answers to, it feeds them better data. API standards remain the backbone for mechanical integrity programs in oil and gas and process industries, covering everything from pressure vessel inspection intervals to fitness-for-service evaluations. The American Petroleum Institute publishes and maintains many of the practices that RBI programs are built around, including risk-based inspection methodology itself.
Analytics outputs need to map cleanly onto these frameworks rather than replace them. A model that recommends extending an inspection interval on a pressure vessel still has to satisfy whatever regulatory inspection minimums apply in that jurisdiction. Most mature programs treat analytics as an input to the RBI calculation, not a substitute for the engineering judgment the standard requires.
Documentation is where analytics programs often get caught out. Regulators and auditors expect a traceable record of why an inspection interval changed. If a model recommendation shifted an interval and nobody logged the reasoning, that’s a compliance gap waiting to surface during an audit. Building the audit trail into the analytics workflow from the start, not bolting it on later, saves a lot of pain.
Industry-specific requirements vary meaningfully. Pipeline operators answer to different inspection mandates than refinery operators, and offshore assets carry their own regulatory layer on top of both. Any analytics program spanning multiple asset types needs to account for these differences in how it structures RBI scoring and inspection recommendations, rather than applying one risk model uniformly across dissimilar assets.
What Actually Goes Wrong When Companies Try This?
The most common failure mode isn’t a bad algorithm, it’s bad expectations. Executives sometimes expect a predictive model to work accurately within weeks of deployment. Most models need months of real operating data, including some failure events, before precision improves enough to trust for high-stakes inspection decisions.
Data quality is the second recurring problem, and it’s rarely a surprise once you look closely. Asset registries with duplicate entries, inspection reports trapped in scanned PDFs, and historian tags that don’t match CMMS asset IDs, all of it undermines model accuracy before the modeling even starts. Teams that skip the data audit step almost always end up redoing it mid-project, at higher cost.
Organizational resistance shows up too, and it’s often justified. Engineers who have run RBI programs manually for twenty years are right to be skeptical of a model’s first set of recommendations. Trust builds through validation, watching the model’s predictions play out against actual asset condition over several cycles, not through a vendor’s accuracy claims on a slide deck.
Cost and scope creep round out the list. It’s tempting to add “just one more” data source or asset class mid-pilot, and that’s exactly how a 90-day pilot turns into an 18-month program with no delivered value yet. Keeping the pilot scope fixed, even when new opportunities surface, protects the timeline.
Finally, false positives from anomaly detection erode trust faster than almost anything else. If the system cries wolf three times in a month, operators start dismissing alerts by default, undoing months of model tuning in a matter of weeks.
How Do You Handle IT/OT Integration and Cybersecurity?
Asset integrity analytics sits at the intersection of operational technology (OT), the sensors and control systems running the physical plant, and information technology (IT), the cloud platforms and databases running the models. That intersection is where most integration friction, and most security risk, lives.
OT networks are typically air-gapped or heavily segmented for good reason: a compromised sensor network can mean a safety incident, not just a data breach. Bringing analytics into that environment usually means a unidirectional data flow, historian data pushed out to a DMZ or cloud environment, without opening inbound access back into the control network. Reversing that flow, letting cloud-based models write commands back into OT systems, requires a much higher security bar and is still rare outside highly controlled pilot environments.

Legacy PLCs and historians weren’t designed with modern authentication in mind, and retrofitting them is often more expensive than replacing the sensor layer entirely. This is one reason IoT sensor projects sometimes bypass the existing historian altogether, running a parallel, purpose-built telemetry pipeline instead of trying to force compatibility with a twenty-year-old system.
Cybersecurity considerations that deserve attention before go-live include network segmentation between OT and IT zones, encrypted data transmission for any telemetry leaving the plant floor, and strict access controls on whoever can modify model outputs that feed inspection decisions. Treating the analytics pipeline as a security boundary, not just a data pipeline, avoids turning a monitoring upgrade into an attack surface.
The Gap Between Analytics Ambition and Analytics Reality
Most vendor pitches skip straight to the predictive model and skip the unglamorous part: whether your asset registry, CMMS, and historian actually agree with each other. That gap is where most of these projects lose a year of runway before anyone opens a modeling tool. The programs that succeed are almost never the ones with the fanciest algorithm. They’re the ones that did a boring data audit first and picked one asset class to prove value on before asking for a bigger budget.
If you’re evaluating this for your organization, the first honest question isn’t “which vendor has the best AI.” It’s “can I trust the data I’d feed that AI right now.” Answer that first. A sensor data fusion approach that gets the inputs right will outperform a sophisticated model running on messy data every time.
— Souhail
How Digitalfractal Helps You Move from Pilot to Production
An AI Readiness Audit can address the common gap in integrity analytics projects by identifying misalignments in registry, CMMS, and sensor data before significant budget is spent. The audit maps your existing data sources, flags the gaps between systems, ranks which assets are ready for a pilot right now, and provides a scoped pilot plan instead of a vague roadmap.
Because the audit is modular, you’re not committing to an enterprise rollout before you’ve seen results on a single asset class. That keeps cost and risk contained while giving you a validated case to bring to leadership before scaling further. Digitalfractal builds tailored solutions for logistics, construction, and oil and gas operators specifically, not generic off-the-shelf consulting, which matters when your asset mix and regulatory obligations don’t match a template.
If your team is trying to figure out whether your data can actually support predictive analytics, start with the AI Readiness Audit and get a concrete answer, plus a pilot plan, within weeks rather than quarters.
Sources
For technical grounding on APM and predictive analytics, see AVEVA’s Asset Performance Management overview and AspenTech’s APM suite. For modular implementation patterns, see Oceaneering’s integrity workflow platform and NDT Group’s technology overview.
- Asset Performance Management
- Asset Performance Management | AspenTech
- Asset Integrity Management Software | Inform™ | Oceaneering
- The digital approach to asset integrity management — Digital Refining
FAQ
What Is Asset Integrity?
Asset integrity is an asset’s ability to operate safely and reliably within its designed limits, without failure, leaks, or unplanned downtime. Programs that manage it, known as asset integrity management, combine inspection, maintenance, and increasingly analytics to keep that reliability measurable rather than assumed.
What Are the 5 P’s of Asset Management?
Definitions of the “5 P’s” vary by organization and industry, so there’s no single standardized version worth treating as canonical. Most frameworks touching asset integrity focus more consistently on people, processes, data, and technology working together, which is the structure this article follows.
What Is ITAM Used For?
IT Asset Management (ITAM) tracks and manages an organization’s technology assets, hardware, software, and licenses, for cost control, compliance, and lifecycle planning. It’s a distinct discipline from industrial asset integrity management, though both rely on accurate asset registries as their foundation.
What Does an Asset Analyst Do?
An asset analyst reviews condition data, inspection records, and performance metrics to assess an asset’s reliability and recommend maintenance or inspection priorities. In analytics-driven programs, that role increasingly involves interpreting model outputs, like predictive maintenance analytics and RBI scores, and validating them against engineering judgment before decisions get made.
How Do You Start an Asset Integrity Analytics Program?
Start with a data readiness audit on one priority asset class rather than a platform purchase across the whole facility. Digitalfractal’s AI Readiness Audit is priced as a one-time engagement and identifies data gaps and a pilot plan before any larger investment.