
End-to-End Testing for ML Pipelines: Key Steps

If I had to cut this article down to one point, it would be this: an ML pipeline is only safe to ship when I test the whole flow, not just single parts. A model can pass training checks and still fail in staging or production because of schema drift, bad date formats, packaging issues, or serving errors.
Here’s the short version of the process:
- I design the pipeline for testing first with clear stage boundaries, fixed inputs and outputs, and versioned data, code, and models.
- I validate data at every handoff for schema, quality, and distribution changes before training and before inference.
- I test training and orchestration end to end with metric thresholds, subgroup checks, latency limits, and failure-path checks.
- I verify deployment and production checks with staging smoke tests, API contract tests, controlled rollouts, drift monitoring, and auto-rollback rules.
A few details matter a lot in practice. For example, I’d check Canadian formats like YYYY-MM-DD, ISO 8601 timestamps such as 2026-08-07T15:30:00-04:00, CAD values like $1,250.00, metric units, and bilingual text fields. I’d also keep audit logs tied to run IDs and timestamps so every pipeline change can be traced later.
The article’s core message is simple: test the pipeline in four steps – design, data validation, training/orchestration, and deployment/monitoring – and block release when any gate fails.
That gives me a clear release checklist instead of guessing whether the system is safe to ship.
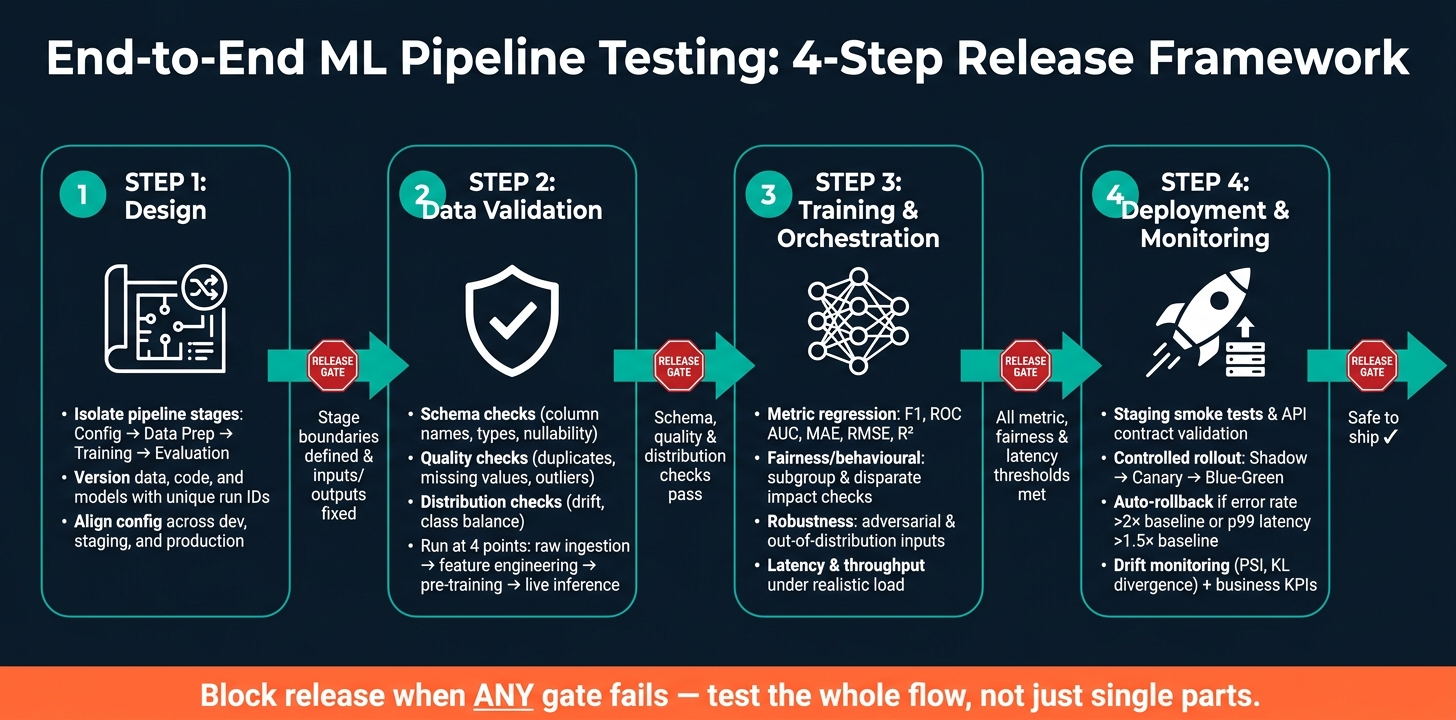
End-to-End ML Pipeline Testing: 4-Step Release Framework
Step 1: Design a Testable Pipeline and Representative Test Data
Start by building the pipeline with machine learning solutions that make it easy to test. That means clear stage boundaries, fixed inputs and outputs, and the same config rules across development, staging, and production. When the setup is clean, E2E tests can fail fast and show you exactly where things went off the rails.
Separate Pipeline Stages and Version Critical Inputs
Split the pipeline into four clear stages: Configuration, Data Preparation, Model Training, and Tracking/Evaluation. Each stage should have a defined input and output, so a failure in one part doesn’t quietly poison the next stage.
Use environment variables to keep credentials and settings aligned across environments. That way, when something breaks, you can trace it back to the stage where it started instead of hunting through the whole pipeline.
Log hyperparameters, code, and artefacts in MLflow. Also use model signatures to catch input/output mismatches before serving. If model performance drops after a pipeline change, you can reproduce the earlier run and see what changed.
Build Small but Representative Test Data Sets
A good test dataset doesn’t need to be big. It needs to look like the data your pipeline will face in practice, including edge cases, not just clean happy-path examples.
Your test set should include a mix of numeric and categorical features from the target domain. For example, fields like age, education-num, marital-status, occupation, race, and sex can help assess bias and discrimination. Define a small set of pass/fail thresholds that each test case must meet.
If the test data includes real personal information, apply context-aware de-identification before it enters the test environment. This helps keep the dataset representative while staying in line with PIPEDA obligations. Document dataset provenance with model cards and data sheets so runs stay reproducible.
Once the pipeline and test data are fixed, check each handoff for drift, schema mismatches, and missing fields.
sbb-itb-fd1fcab
Step 2: Validate Data Before Training and Serving
Data validation is the first gate in an ML pipeline. If bad data slips through, everything that comes after gets shaky. Automated checks should stop bad data before training or serving starts. And the test data from Step 1 should power those checks at every gate.
Check Schema, Quality, and Distribution Changes
Most data failures land in three buckets: schema, quality, and distribution.
Schema checks confirm column names, data types, nullability, and allowed categories. In plain terms, you’re checking that the data looks the way your system expects it to look. Use MLflow’s infer_signature to record the expected input and output schema, then reject malformed requests at serving time.
Quality checks catch duplicates, missing values, and outliers before they move into feature engineering. That matters more than people think. A single messy field can throw off an entire training run. It also helps to validate currency fields and date formats against expected patterns, especially in pipelines that pull from multiple Canadian business systems, where formats can differ from one source to the next.
Distribution checks look for shifts in key feature distributions and class balance between training and production data. This is how you spot drift early, before model performance starts to slide in ways that are slow and painful to trace back later.
Add Validation at Every Handoff in the Pipeline
Every stage change is a chance for data to get corrupted, truncated, or knocked out of alignment. So don’t wait until the end. Run checks at four points:
- raw ingestion
- before feature engineering
- before training or retraining
- on live inference inputs
TensorFlow Data Validation (TFDV) works well for large TFX-based pipelines. Great Expectations is a good fit for Python-heavy data engineering teams. If you’re working with large Spark jobs, Deequ lets teams write data tests in Scala or Python and report metrics at scale.
Log every validation result with a timestamp and pipeline-run ID. That gives you an audit trail, makes failures easier to trace, and supports frameworks such as the NIST AI Risk Management Framework.
Data Validation Tools Compared
| Tool | Scale | Ecosystem Fit | Rule Authoring | Reporting |
|---|---|---|---|---|
| Great Expectations | Medium to Large | Python / Data Engineering | Python-based "Expectations" | Detailed "Data Docs" (HTML) |
| TensorFlow Data Validation (TFDV) | Large | TensorFlow / TFX | Automated schema inference | Facets-based visualisation |
| Deequ | Very Large | Spark / AWS | Unit tests for data (Scala/Python) | Metrics-based |
Once data clears these gates, the next step is to test training, evaluation, and orchestration.
Step 3: Test Model Training, Evaluation, and Pipeline Orchestration
Once data clears validation, the next job is to make sure the training pipeline still turns that data into a stable model. You want to test the full path, from versioned data ingestion to trained output, and check that results stay repeatable.
Run Metric Regression, Behavioural, and Performance Tests
Each training run should be checked against a baseline. For classification models, track F1 score, ROC AUC, precision, and recall. For regression models, monitor MAE, RMSE, and R². Tools like mlflow.evaluate() can compute these during the pipeline run and log them with hyperparameters and model signatures, which makes tracing issues much easier later on.
Set hard pass/fail thresholds for quality, fairness, latency, and throughput. If any threshold is missed, the pipeline should fail right there. Fairness checks need the same treatment. If subgroup analysis shows disparate impact, that’s not something to leave for a later meeting. It should count as a pipeline failure.
Accuracy alone isn’t enough. Latency and throughput also need testing under realistic load before any model goes to production. A model can look fine in offline testing and still fall apart when traffic hits. If it times out under load, it isn’t ready.
Verify Orchestration Logic, Dependencies, and Failure Handling
Test orchestration on its own. Start with smoke tests, then run a full end-to-end pass before promotion. Make sure task dependencies run in the right order, a failed upstream stage blocks downstream stages cleanly, and the same run produces the same logged artefacts, metrics, and failure behaviour.
Audit logs with pipeline-run IDs and timestamps are a must. They’re what let teams trace a bad model output back to a specific data version or configuration change. These checks connect straight into deployment and serving validation.
Model and Pipeline Test Types Compared
| Test Type | Purpose | Typical Inputs | Failure Conditions |
|---|---|---|---|
| Metric Regression | Check that model quality has not slipped | Holdout / test datasets | F1, RMSE, or ROC AUC falls below baseline |
| Behavioural / Fairness | Find bias and ethical misalignment | Subgroup-specific data, edge cases | Disparate impact or fairness threshold breached |
| Robustness / Input Handling | Check input handling and stability | Adversarial inputs, out-of-distribution data | Invalid inputs, NaNs, or malformed predictions |
| Latency / Resource | Check runtime efficiency | Realistic concurrent load simulations | Throughput below threshold or CPU/memory spikes |
Step 4: Validate Deployment, Serving, and Monitoring
Once training and orchestration pass, test the release path itself. A model can clear training and still break in production. Packaging issues, dependency mismatches, latency spikes, and drift often show up later, when real traffic hits the system. The goal here is simple: catch those problems before users feel them.
Confirm Model Packaging, Endpoint Health, and Serving Guardrails
Start in a staging environment that mirrors production as closely as possible. Use the same versioned inputs, signatures, and thresholds from the earlier steps. Begin with smoke tests at start-up so the container loads the model and runs a test inference before any live traffic gets through. Then run API contract tests to check request and response schemas at serving time.
For Canadian deployments, make sure date and time fields use ISO 8601 with a clear time zone offset, such as 2026-08-07T15:30:00-04:00. Also check that postal codes follow the A1A 1A1 format, with case-insensitive matching.
Set p95 latency and error-rate gates, and stop the release if staging load tests miss them. Serving guardrails should also cover:
- Input-range checks
- Output caps or rounding
- A fallback rule when the model fails
If staging clears those checks, move to a controlled release with expert AI insights.
Use Controlled Release Patterns and Continuous Monitoring
After release, keep watching live traffic, drift, and business impact. Don’t switch all traffic at once. Route a small slice first, then scale up bit by bit. Give each step enough time to show whether the system is stable.
Set auto-rollback triggers too. For example, if the new model’s error rate goes above 2× the baseline, or p99 latency rises past 1.5× baseline, traffic should switch back on its own.
Use shadow deployments when you want zero user impact and need to compare live behaviour before promotion.
Track the same failure modes you checked offline, but now on production traffic. Measure data drift with population stability index (PSI) or KL divergence on key input features. Watch business KPIs along with system metrics, such as fraud rate or revenue in CAD, not just HTTP error rates. Keep a living incident record so drift and new failure patterns are logged over time. Re-run E2E tests on anonymised production samples after retraining or major schema changes.
Deployment Patterns and Monitoring Checks Compared
These rollout patterns trade off risk, visibility, and cost.
| Pattern | User Risk | Observability Needs | Rollback Speed | Compute Cost |
|---|---|---|---|---|
| Shadow | None – predictions are discarded | Very high – compare outputs and KPIs offline | Instant – disable shadow routing | ~2× baseline (both models run) |
| Canary | Low – starts with a small traffic slice | High – compare canary vs. baseline metrics per step | Fast – re-route traffic within minutes | Minimal overhead |
| Blue-Green | Low before switch; higher blast radius at cut-over | Moderate – validate green fully before switching | Very fast – flip traffic back to blue | Moderate – two environments running in parallel |
Conclusion: An End-to-End Testing Checklist for Enterprise ML
Here’s the four-step flow in plain terms: design for testability first using AI-powered workflow automation, check data at every handoff, test model behaviour and orchestration before promotion, and then verify deployment and monitoring in production-like conditions.
For Canadian teams, these gates do more than keep releases tidy. They also create an audit trail for risk, compliance, and legal review through versioned data, archived test results, and deployment records.
Use the checklist below as the release gate for each pipeline change.
| Phase | Key Gate |
|---|---|
| Design | Pipeline stages isolated; data, features, and models versioned with unique IDs |
| Data validation | Schema, quality, and distribution checks pass before training and serving |
| Model & orchestration | Metric regression and behavioural tests clear; DAG failure scenarios tested |
| Deployment | Packaging, API contract, and latency/SLA checks pass in staging |
| Monitoring | Drift alerts, business KPIs, and rollback triggers active on live traffic |
Use this checklist as the release gate for every ML pipeline change.
FAQs
How small can an E2E test dataset be?
There’s no fixed minimum size for an end-to-end (E2E) test dataset. What matters is using data that looks and behaves like the data your business deals with day to day.
That means using a mix of valid data combinations, including edge cases and less common scenarios, so key workflows get tested under conditions that feel real, not watered down or overly neat. If your test data is too simple, you can miss issues that only show up in live business situations.
For Canadian operations, use synthetic or anonymized data to help meet PIPEDA requirements.
What should block an ML pipeline release?
An ML pipeline release should stop the moment any automated test, validation check, or security gate fails. If a control can’t reliably block a merge, deployment, or release, it needs to be fixed or taken out.
The main release blockers include:
- Failed security checks
- Missed model performance thresholds
- Policy-as-code breaches
- Failures in required pre-deployment reviews
- Privacy compliance assessment failures
- Failures in critical automated test suites
This needs to be strict. A gate that looks serious but doesn’t actually stop a bad release is just dead weight.
How often should ML pipeline drift checks run?
ML pipeline drift checks should run all the time, not as a one-off review. Data shifts. User behaviour changes. And when that happens, model performance can slip without much warning.
That’s why monitoring should be part of an ongoing governance cycle, not a box you tick once and move on.
Automated runtime monitoring does a lot of the heavy lifting. But it shouldn’t work alone. Periodic manual reviews and regular re-assessments help you catch issues that dashboards may miss and make sure the system still does its job as the outside world changes.