Knowledge Graphs for the Enterprise: What They Are and How to Build One

An enterprise knowledge graph connects your data across systems into one governed, queryable map of the things your business runs on: customers, shipments, assets, contracts, suppliers and the relationships between them. It pays off most when your data is spread across many systems and your questions keep changing, which is exactly the situation of most logistics, construction and energy operators. This guide explains how it works, where it earns its keep, how to build one in stages, and what to settle before you start.
TL;DR
- An enterprise knowledge graph links data from many systems through a shared business vocabulary (an ontology), so people and AI tools can ask questions across silos.
- It is a design pattern, not a product. A graph database can store it, but the meaning, identity and governance layers are what make it useful.
- The strongest early use cases are supplier and carrier risk mapping, disruption analysis and grounding an enterprise AI assistant in verified facts.
- Most builds fail for organizational reasons: no sponsor, no defined use case, no ontology discipline. Start with one domain and a handful of sources.
- Before building, check data readiness, access control, Canadian privacy obligations, skills and budget.
Table of Contents
- What an enterprise knowledge graph is
- Knowledge graph vs. graph database vs. your current data stack
- Where an enterprise knowledge graph earns its keep
- How to build one: five stages, one domain
- Keeping the graph alive: governance and maintenance
- What to settle before you start
- Our perspective
- Start with an AI Readiness Audit
- FAQ
- Sources
What an enterprise knowledge graph is
A knowledge graph stores entities and their relationships as explicit, queryable structure. The enterprise version is scoped to serve a broad range of information needs across the whole organization. According to the Enterprise Knowledge Graph Foundation’s method guide, it connects data objects and the information describing their meaning, in internal and relevant external systems, potentially down to the most granular level.
Think of a shipment. In your transport management system it is a load number. In billing it is an invoice line. In the carrier scorecard it is a trip, and in the facility master data it is a dock appointment. A relational setup keeps these as separate records and relies on joins and spreadsheets to reconcile them. A knowledge graph gives the shipment one identity and links it to the carrier, the lane, the customer, the facility and the contract, with each link carrying its own meaning.
The Bank of Canada has described what this takes in a public presentation on breaking down data silos. It names four components: distributed data, semantic metadata drawn from taxonomies and ontologies, connected data whose meaning comes from its links to other data, and graph algorithms that extract structure and infer behavior. The same presentation makes a point worth remembering: the more distributed your data, the stronger the case for a graph. Its value lies in flexibility when data is complex and changing, in describing data in business terms, and in handling questions nobody anticipated when the systems were built.
The four working parts
In practice, an enterprise graph rests on four things that depend on each other, as described in a 2026 explainer:
- An ontology. A formal model of entity types, relationships and attributes. It is the shared language between the business and the data.
- Entity resolution. The process of consolidating duplicate identifiers into one canonical record, so “ACME Freight Ltd.” and “Acme Freight” are the same carrier.
- Ingestion and synchronization. Batch loads, change data capture or API-based federation that keep the graph current.
- Governance. Access controls, audit trails and provenance records, so every fact can be traced to its source.
Skip any one of these and the graph degrades into a pretty diagram. Entity resolution deserves special attention. If you want the search-visibility side of the same idea, where entities and their relationships decide whether AI engines cite a brand, this walkthrough of knowledge graph SEO fixes shows how the same principle works on the public web.
Knowledge graph vs. graph database vs. your current data stack
These terms get mixed up, and the confusion leads to bad purchasing decisions. A primer from a graph database maker puts it plainly: a knowledge graph is a design pattern for storing, organizing and querying entities and relationships, while a graph database is the technology that stores graphs. You can build a knowledge graph without a graph database, but a graph database matches its natural structure closely. The same source notes that relational databases need joins to reconstitute relationships, which complicates design and maintenance and can hurt performance.
The practical split looks like this:
| Relational warehouse | Graph database | Enterprise knowledge graph | |
|---|---|---|---|
| Main job | Reporting on structured tables | Storing and traversing connected data | Shared meaning across systems, plus connected data |
| Relationships | Rebuilt with joins | Stored as first-class links | Stored as links with defined business meaning |
| Vocabulary | Column names per system | Optional schema | Governed ontology |
| Handles new questions | Needs new models or queries | Good for path and network queries | Good, with rules and inference on top |
| Typical owner | Data engineering | Engineering team | Data, domain experts and engineering together |
As one industry commentary in Database Trends and Applications frames it, the graph database is the infrastructure layer for connected data, and the knowledge graph adds a semantic reasoning layer on top. Buy storage for the first, invest your effort in the second.
This also means a knowledge graph does not replace your warehouse, ERP or TMS. It sits in front of them as a semantic layer, and your existing systems stay the systems of record.
Where an enterprise knowledge graph earns its keep
A graph is justified by the questions it lets you answer, not by the technology. Three families of use cases come up again and again.
Logistics and supply chain
A 2026 supply chain graph guide lists use cases that fit logistics firms well:
- Multi-tier supplier risk mapping: when a disruption hits, you identify affected shipments immediately instead of after a day of spreadsheet work.
- Hidden dependency discovery: carriers that look independent turn out to subcontract to the same regional operator, a concentration risk no single system shows.
- Disruption cascade modeling: estimating total network impact in minutes rather than days.
There is also a published adoption example. A procurement services firm connected supplier data from ten or more ERP systems through a knowledge graph. According to a trade report, its customers report supplier discovery that is 75% faster, and supply chain processes that once took 100 to 180 working hours over 24 weeks now take 8 to 12 hours over six weeks. Those are one company’s reported results, not a benchmark you should expect to copy, but they show the scale of effect when fragmented data is finally connected.
Operations in asset-heavy industries
Construction, oil and gas and field-service businesses hold equipment, maintenance, inspection, crew and compliance records in separate tools. A graph that ties an asset to its maintenance history, its sensors, its operator and its work orders makes predictive maintenance far easier, because the model sees the context around each reading and not just the reading.
Grounding an enterprise AI assistant
This is the use case driving most current interest. An enterprise AI assistant that answers from documents alone can retrieve text that looks relevant but is wrong, stale or unrelated to the entity you asked about. A graph gives the assistant verified entities, relationships and sources to reason over.
There is published evidence for the effect. An Adobe research paper describes a knowledge-graph-enhanced retrieval system that uses incremental entity resolution, similarity-based deduplication, confidence scores and links back to source documents. Against the existing production system, it reduced irrelevant answers by 51.9% and increased fully relevant answers by 88.2%. That is one team’s result on its own data, but it points to why provenance and entity resolution matter more than a bigger model.
If you are weighing the retrieval side, our guide to retrieval-augmented generation explains how it works and when to use it. For a worked example of a graph-aware assistant in an operational setting, see our case study on engineering a safer, graph-aware operational AI assistant.
How to build one: five stages, one domain
The most reliable pattern is to bound the project to a single domain and move through defined stages. One construction guide breaks the work into five stages and gives indicative durations:
| Stage | What happens | Indicative duration |
|---|---|---|
| 1. Assess and scope | Inventory existing metadata, pick one domain, define the questions the graph must answer | 1 to 2 weeks |
| 2. Design | Build the ontology and schema with domain experts | 2 to 4 weeks |
| 3. Extract | Pull entities and relationships from structured and unstructured sources | 1 to 3 weeks |
| 4. Resolve | Merge duplicates into one golden record per entity | 2 to 4 weeks |
| 5. Validate and activate | Rules, schema checks and human review before production | 1 to 2 weeks |
The same source observes that most enterprise builds stall at entity resolution and ontology alignment, not at extraction. Plan your time and your best people accordingly.
What a pipeline looks like in production
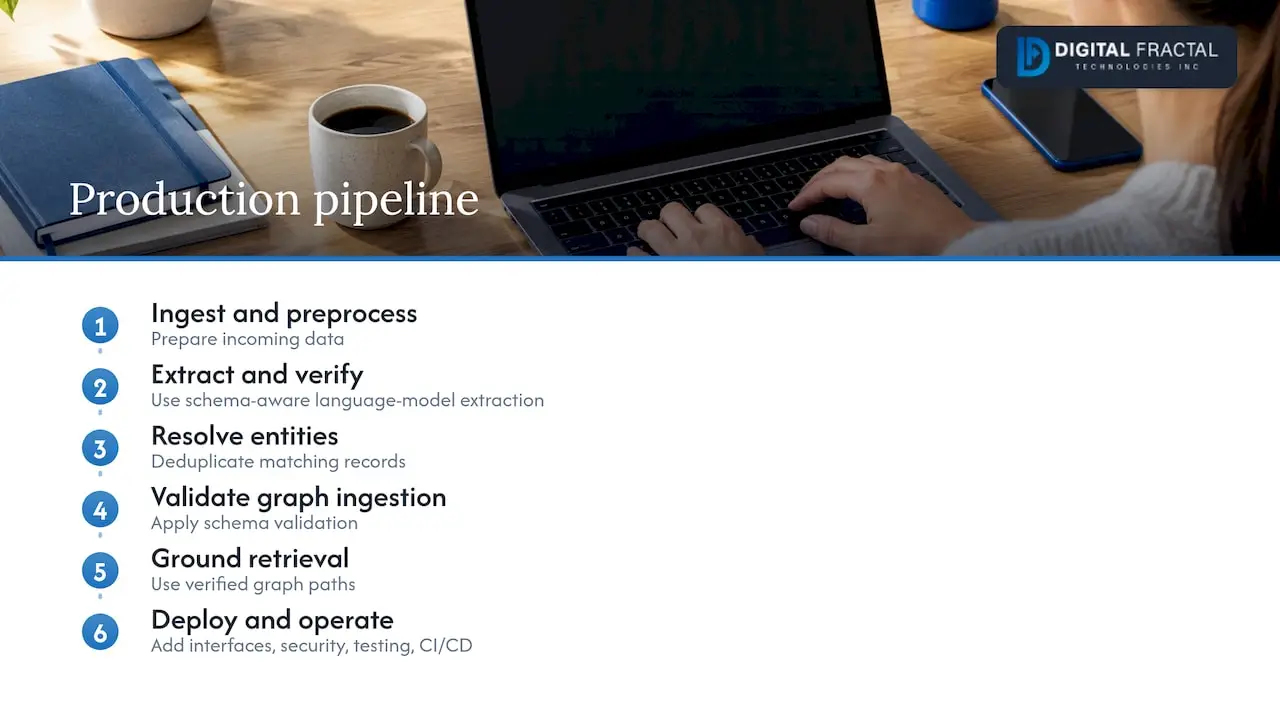
For AI use, a production pipeline guide describes ingestion and preprocessing, language-model-based extraction with schema-aware verification, entity resolution and deduplication, graph ingestion with schema validation, and a retrieval layer that grounds model answers in verified graph paths. A peer-reviewed procedure model adds that the production phase includes deployment into existing infrastructure, interfaces and security for applications, performance testing and automation of the whole construction process, with CI/CD tooling to support it.
A realistic first 90 days for a logistics team
One published supply chain timeline is a useful template:
- Days 1 to 30: pick three to five critical sources (typically the TMS, carrier scorecards and facility master data), build ingestion pipelines, and define core entities and relationships.
- Days 31 to 60: construct and validate the graph, and run baseline queries.
- Days 61 to 90: deploy graph algorithms for risk scoring, dependency analysis and disruption cascade modeling, with dashboards and alert workflows.
The point is not the exact numbers. It is the discipline: few sources, one domain, visible output at the end of the quarter.
Keeping the graph alive: governance and maintenance
A graph that nobody maintains goes stale in months. Research on knowledge graph ecosystems published in the VLDB proceedings argues that these systems need clearly defined life cycles covering creation, maintenance and evolution, with coordinated workflows for ingestion, validation, reasoning and update propagation. It also calls for tracing mechanisms that follow data provenance, and validation that checks consistency, completeness and adherence to domain constraints.
Turned into working habits, that means:
- Name an ontology steward. Someone owns the vocabulary and approves changes.
- Version the schema. Changes go through review, not through whoever loaded data last.
- Check conformance automatically in the pipeline, and alert when a source system starts sending data that breaks the schema.
- Record provenance on every fact: where it came from and when it was loaded.
- Keep history. Give relationships validity dates so that a carrier contract that ended is marked ended, not deleted.
- Keep a human in the loop for ambiguous matches and for new relationship types.
Without executive sponsorship and a defined use case, graphs tend to become unused data museums. That failure is organizational, so settle the sponsor and the first question before you choose a tool.
What to settle before you start
A Forbes Technology Council article lays out the evaluation areas that matter. Here they are, with a Canadian lens.
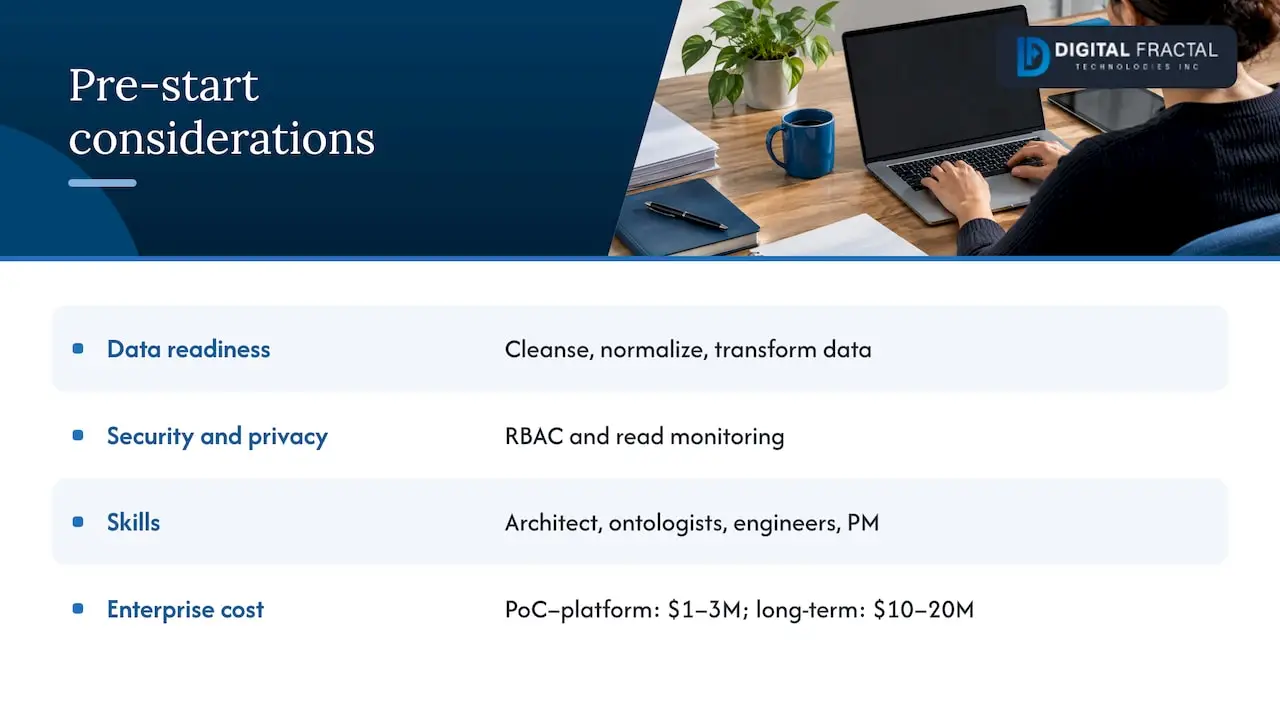
Data readiness. Silos, inconsistent formats and quality problems need cleansing, normalization and transformation before they go into a graph. A graph exposes dirty data faster than a dashboard does. Our guide to enterprise data readiness shows how to assess where you stand.
Security and privacy. Role-based access control has to cover the graph itself, with monitoring of who reads what. The same article notes that under PIPEDA, Canadian organizations stay accountable for personal information regardless of which tool processes it, and data residency requirements may apply. If your graph links people to shipments, sites or incidents, involve your privacy officer at the ontology stage, not after launch.
Skills. Expect to need an experienced architect, ontologists, knowledge graph engineers and a project manager, plus training for existing teams. Many mid-sized firms fill part of that bench with an outside partner.
Cost. The same source puts the combined budget from proof of concept through pilot to platform between US $1 million and $3 million, with long-term enterprise graph costs around $10 million to $20 million, citing Cutter Consortium figures from 2023. Those figures describe large enterprise programs. A bounded, single-domain start costs a fraction of that, which is the argument for starting small. Cost drivers to watch: data preparation, infrastructure, expertise, maintenance and integration with existing systems.
To see whether your organization is ready for any of this, the AI readiness checklist and the broader piece on the key components of an enterprise AI strategy are good places to start.
Our perspective
We see the same pattern in the Canadian logistics, construction and energy teams we talk to. They do not lack data. They lack a shared meaning for it. The carrier in dispatch is not quite the carrier in finance, and nobody can say so with confidence.
That is why we do not start with a graph platform. We start with one painful question, the two or three systems that hold the answer, and a plan to show results inside 90 days. Our approach is built around your workflows, your systems and your goals, not an off-the-shelf template.
In our experience, the graph is rarely the hard part. The hard part is deciding what an entity is, who owns it, and what the assistant or automation is allowed to do with it. When those decisions are made early, the AI work that follows, whether an operational assistant, an agent or a predictive model, becomes safer and much easier to trust.
That is why we pair graph thinking with an AI readiness audit first. It tells you which data is ready, which use case should go first and what to leave for later.
Souhail
Start with an AI Readiness Audit
If you are deciding whether a knowledge graph is the right next step, our AI Readiness Audit is built to answer that. It looks at your data, systems and workflows, and identifies where automation and AI integration will pay off first. It is a one-off engagement priced from $2,500 to $10,000 depending on scope, and it gives you a prioritized plan rather than a generic report.
From there we can design and build the solution with you, from workflow automation to AI agents and assistants, aiming for tangible results within 90 days. Read about our AI integration consulting or contact us through our site to talk through your use case.
FAQ
Do we need a graph database to build an enterprise knowledge graph?
Not strictly. A knowledge graph is a design pattern, and it can be built without a graph database. That said, graph databases match its structure closely and make relationship queries simpler, so most teams use one for the storage layer.
How is an enterprise AI assistant different from a chatbot on top of documents?
A document-only chatbot retrieves passages that look similar to the question. An enterprise assistant grounded in a knowledge graph can also use verified entities, relationships and source links, which cuts irrelevant answers and makes each answer traceable. It still needs access controls so users see only what they are allowed to see.
How long does it take to build a first knowledge graph?
For a single, well-scoped domain, published construction guides give roughly seven to fifteen weeks across scoping, design, extraction, resolution and validation. A logistics-focused plan can show working risk and dependency analysis inside 90 days. Entity resolution and ontology alignment are usually where schedules slip.
Where should a logistics company start?
Pick one question that costs you money today, such as which shipments are exposed when a carrier or facility fails. Connect the three to five systems that hold the answer, define the core entities, and validate with the people who run operations. Then expand to the next domain.
Is a knowledge graph the same as RAG?
No. Retrieval-augmented generation is a technique for supplying a language model with relevant information at answer time. A knowledge graph is a structured store of entities and relationships that can be one of the sources RAG draws on, which is why graph-based retrieval is often used for more reliable assistants.
Sources
- Enterprise Knowledge Graph (EKG) – Use Case Tree Method
- Knowledge Representation and breaking down silos at the Bank of Canada
- What Is an Enterprise Knowledge Graph?
- Is a knowledge graph a graph database?
- The Potential of Graph Databases and Knowledge Graphs
- Supply Chain Knowledge Graphs: How Graph AI Is Replacing Legacy Visibility
- Graph Databases: A resilient solution for evolving supply chains
- From Documents to Dialogue: Building KG-RAG Enhanced AI Assistants
- Knowledge Graph Construction for AI: Enterprise Data Graph
- Knowledge Graph with LLMs: Enterprise AI Guide
- Procedure Model for Building Knowledge Graphs for Industry Applications
- From Genesis to Maturity: Managing Knowledge Graph Ecosystems
- Demystifying Knowledge Graphs: Unlocking The Power Of Connected Data