
AI Inventory Optimization: A Practical Guide for Supply Chain Managers

Inventory optimization AI uses machine learning and reinforcement learning to automatically calculate reorder quantities, safety-stock buffers, and replenishment policies across your entire network, replacing spreadsheet rules and gut-feel decisions with data-driven, continuously updated plans. The short verdict: if you manage more than 500 SKUs, run a multi-location network, or deal with persistent stockouts and excess stock simultaneously, AI will almost certainly outperform your current approach. The immediate next step is a 4–6 week AI readiness audit to map your data gaps and identify the highest-ROI pilot.
Who should consider an AI pilot now:
- Operations with high SKU complexity, seasonal demand swings, or frequent promotions that break static safety-stock formulas
- Distributors or manufacturers running multi-echelon networks where a stock decision at one node ripples through others
- Businesses sitting on six or more months of daily or weekly demand history with ERP or WMS data they can extract cleanly
Key Takeaways
| Point | Details |
|---|---|
| Start with an AI readiness audit | A 4-week audit identifies data gaps, integration points, and the highest-ROI pilot candidates before any model spending. |
| Pilot on AX-segment SKUs first | High-revenue, stable-demand SKUs produce defensible ROI signals in 8–12 weeks with the least modeling noise. |
| Require closed-loop integration | Forecasting and replenishment must be connected end-to-end; decoupled systems consistently underperform in live deployments. |
| Match method to complexity | ML probabilistic models suit most first pilots; DRL and OR-guided hybrids add value at multi-echelon scale. |
| Measure against a holdout group | Designate a control cohort before go-live; without a baseline comparison, ROI claims are not defensible. |
| Digitalfractal next step | Digitalfractal’s AI Audit and Opportunity Assessment delivers a scoped pilot roadmap within four weeks for logistics, distribution, and manufacturing operations. |
Table of Contents
- What does inventory optimization AI actually cover?
- Why AI inventory optimization produces measurable business results
- Core features every AI inventory system should have
- How AI methods for inventory optimization actually work
- Signals that AI will add value in your operation
- KPIs to measure and realistic outcome ranges
- Step-by-step adoption roadmap from pilot to scale
- Common failure modes and how to avoid them
- Recent research results: DRL, OR-guided hybrids, and what they mean for practitioners
- What an AI readiness audit actually reveals
- Digitalfractal’s AI integration consulting for inventory operations
- Frequently asked questions
- Sources
What does inventory optimization AI actually cover?
The term gets used loosely, so the scope boundaries matter. Inventory optimization AI refers to systems that ingest historical demand, lead-time, and cost data to produce optimal inventory policies: how much to order, when to order it, how to split stock across locations, and how much buffer to hold against uncertainty. The outputs are concrete: reorder-point and order-quantity recommendations, probabilistic safety-stock levels, replenishment schedules, and network-level allocation plans.
Included tasks:
- Demand forecasting (probabilistic, not just point estimates)
- Safety-stock calculation tuned to actual lead-time variability
- Replenishment policy generation (continuous review, periodic review, min/max)
- Multi-echelon inventory optimization across warehouses, DCs, and stores
- SKU segmentation and classification (ABC-XYZ and ML-based clustering)
- Real-time inventory signals, alert triggers, and decision logs
Not included: warehouse layout design, pick-path optimization, manual picking UX, or general ERP customization. Those are adjacent problems. A good AI inventory system integrates with your WMS and ERP but does not replace them.
Why AI inventory optimization produces measurable business results
The business case is straightforward once you see the numbers. A systematic review of 87 articles published between 2021 and 2025 found that ML, deep learning, reinforcement learning, and hybrid methods consistently outperform classical inventory rules across demand forecasting accuracy, stockout reduction, and total cost. The practical challenges the review flags — data dependency, interpretability, and implementation overhead — are real, but solvable with the right architecture.
Core benefits and what they mean for the business:
- Reduced holding costs: Right-sized safety stock frees working capital that would otherwise sit on shelves. One industry case study of a 2,000-SKU, 50-location distributor reported $80M in freed working capital after deploying a graph-based multi-echelon model.
- Fewer stockouts: Probabilistic demand forecasting catches tail-risk demand events that moving-average rules miss entirely.
- Higher fill rates: Automated replenishment policies respond to lead-time shifts within days, not the next planning cycle.
- Lower obsolescence risk: SKU segmentation surfaces slow-movers before they age into write-offs.
- Freed working capital: Inventory turns improve when stock is positioned where demand actually lands, not where it landed last year.
Research benchmark: An integrated LSTM + Q-learning framework tested in multi-stage manufacturing settings cut total inventory-related costs by approximately 15.7% compared with traditional MRP systems, while achieving near-zero stockout rates in benchmarked scenarios.
The cashflow consequence is often what gets executive attention.
Core features every AI inventory system should have
Not all vendor platforms deliver the same depth. Here is what to require, and why each capability earns its place.
Probabilistic demand forecasting
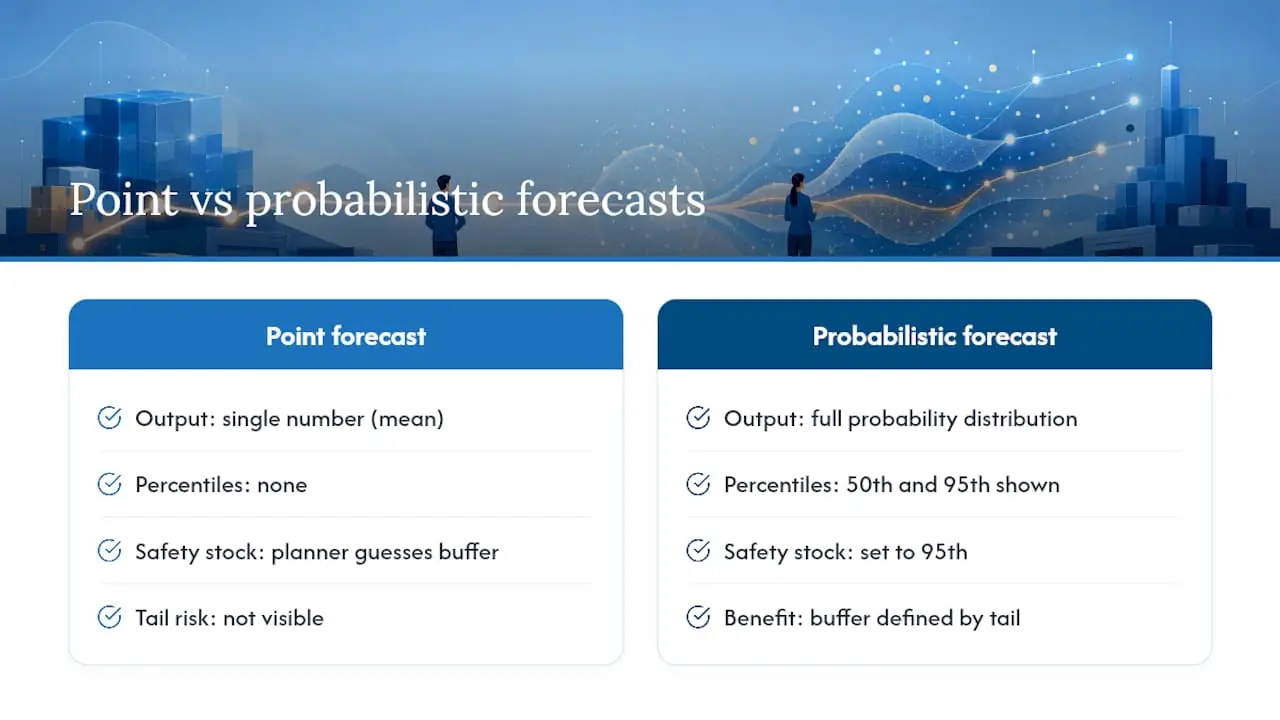
Point forecasts (a single number) are not enough. You need a distribution: the 50th-percentile demand and the 95th-percentile demand, because safety stock is set against the tail, not the average. Systems that output only a mean forecast force you to guess the buffer yourself.
Automated safety-stock calculation
Static safety-stock formulas (k × σ × √L) work when lead times are stable. They fail when lead times shift, which happens constantly. AI systems recalculate safety stock dynamically using actual lead-time distributions, not assumed ones.
Replenishment policy generation
The system should output a complete policy: review frequency, reorder point, order quantity, and the cost assumptions behind each. Policies without explanations are black boxes that operations teams will override and eventually abandon.
SKU segmentation
Pro Tip: Before building any forecasting model, run an ABC-XYZ segmentation first. ABC ranks SKUs by revenue contribution; XYZ ranks by demand variability. The AX segment (high revenue, stable demand) is where your first pilot should focus — these SKUs have enough data volume and enough business impact to produce a defensible ROI statement in 8–12 weeks, without the noise that high-variability SKUs introduce.
Multi-location and multi-echelon optimization
Stock decisions at a regional DC affect what stores need to hold. Systems that optimize each location independently miss the network-level trade-offs. Multi-echelon models treat the whole network as one system.

Real-time signals and alerting
Inventory positions change daily. A system that runs weekly batch updates will miss a demand spike or a supplier delay until it is too late. Real-time or near-real-time alerting on anomalous demand or lead-time changes is the difference between proactive and reactive management.

Explainability and decision logs
Every recommendation should carry a reason: which signals drove it, what cost assumptions were used, and what the model’s confidence interval is. Without this, your team cannot audit decisions, and regulators or auditors cannot trace outcomes.
How AI methods for inventory optimization actually work
Understanding the architecture helps you evaluate vendor claims and decide whether to build or buy.
The main method families
Classical ML (XGBoost, LightGBM): Gradient-boosted trees trained on tabular features (lag demand, price, promotions, calendar). Fast to train, highly interpretable, and strong on structured data. The go-to for demand forecasting when you have clean historical data and need explainability.
Time-series deep learning (LSTM, CNN-LSTM, attention/transformer models): Sequence models that capture long-range temporal dependencies. LSTM and its variants handle seasonality and trend shifts that tree models miss. Attention-based models (similar in spirit to the transformer architecture) are now competitive on many supply-chain forecasting benchmarks.
Probabilistic forecasting: Methods like DeepAR, Prophet, or quantile regression that output full demand distributions rather than point estimates. Required for any safety-stock calculation that needs to be defensible.
Deep Reinforcement Learning (DRL): An agent learns replenishment policies by interacting with a simulated inventory environment, optimizing a cost function directly. DRL handles multi-echelon complexity and non-stationary demand better than rule-based policies, but it requires careful design. Policy regularizations that encode classical inventory concepts — like base-stock behavior — into DRL training dramatically improve stability, reduce hyperparameter sensitivity, and make full-scale deployment practical. This approach enabled a production DRL deployment at a major e-commerce platform.
Hybrid AI + Operations Research (OR-guided): The most production-mature approach for large-scale deployments. OR-derived reference decisions (from classical solvers) are used to pretrain a deep model, which is then fine-tuned with reinforcement learning. The result: AI adaptability with structural operational logic baked in. Field validation of this pretrain-then-reinforce framework showed a 5.27-day reduction in inventory turnover days, a 2.29% increase in in-stock rates, and approximately a 29.95% decrease in holding costs.
Method comparison
| Method | Accuracy | Data needs | Interpretability | Compute cost | Deployment maturity |
|---|---|---|---|---|---|
| Classical ML (XGBoost/LightGBM) | High (tabular) | Low–medium | High | Low | Very high |
| LSTM / CNN-LSTM | High (sequential) | Medium | Medium | Medium | High |
| Probabilistic forecasting | High (distributions) | Medium | Medium | Medium | High |
| Deep Reinforcement Learning | Very high (policy) | High | Low–medium | High | Medium |
| Hybrid AI + OR | Very high | Medium–high | Medium–high | Medium–high | Growing fast |
When to prefer each approach:
- Use probabilistic forecasting whenever safety-stock calculations need to be auditable.
- Choose DRL when you have a complex multi-echelon network and a simulation environment you can build or buy.
- Default to hybrid AI+OR for large-scale production deployments where interpretability and training stability matter as much as raw accuracy.
Signals that AI will add value in your operation
AI is not the right answer for every inventory problem. These are the practical triggers that indicate a pilot is worth running.
The math changes fast when complexity grows. Consider a pilot when you see:
- More than 500 active SKUs with meaningful demand variability across them
- A multi-echelon network (at least one DC feeding multiple downstream locations)
- Frequent promotions, new product launches, or seasonal patterns that break static forecasts
- Carrying costs above 20–25% of inventory value annually (a common threshold where optimization ROI becomes compelling)
- Persistent simultaneous stockouts and overstock — the classic sign that your current policy is not differentiating among SKUs
Minimum data requirements to check before starting:
- At least 6 months of daily or weekly demand history per SKU (12–24 months is better for seasonal items)
- Lead-time records at the purchase-order line level, not just averages
- Cost data: unit cost, holding cost rate, stockout penalty or lost-sale estimate
- Clean item master data with consistent SKU identifiers across ERP and WMS
Common data gaps that kill pilots: demand data stored only as aggregated monthly buckets, lead times recorded only as contracted (not actual), and no linkage between demand records and promotional events. Check these before you sign a vendor contract.
For e-commerce and distribution operations, the bar is often lower because transaction data is already digital and granular. Manufacturing environments typically need more data-engineering work upfront.
KPIs to measure and realistic outcome ranges
A pilot without a measurement plan is just an experiment. Define your KPIs before the model goes live, not after.
Core KPIs to track:
- Inventory carrying cost (total, and as % of inventory value): the primary cost metric
- Stockout rate (% of SKU-days with zero available stock): service-level proxy
- Fill rate / order fill rate: customer-facing service metric
- Inventory turns: efficiency metric; higher is generally better
- Working capital tied to inventory: the CFO metric
- Forecast error (MAE, MAPE, WAPE): model accuracy metric; use weighted versions for SKU portfolios
- Service-level attainment vs. target: the operational SLA metric
Realistic improvement ranges from research:
- Total cost reduction vs. MRP: approximately 15.7% in integrated DL+RL frameworks
- DRL vs. classical benchmarks in multi-echelon networks: 6.6%–16.4% cost improvement depending on network structure
- Holding cost reduction with OR-guided hybrid: approximately 29.95% in field deployment
- In-stock rate improvement: approximately 2.29 percentage points in the same field deployment
Pilot measurement checklist:
- Designate a holdout group: at least one warehouse or SKU cohort managed under the old policy for direct comparison
- Run the pilot for a minimum of 8–12 weeks to capture at least one full replenishment cycle
- Log every model recommendation and whether it was accepted, overridden, or modified by a planner
- Record the reason for every override — this data is gold for model improvement
- Capture baseline KPIs for the 12 weeks before the pilot starts, using the same measurement definitions
Step-by-step adoption roadmap from pilot to scale
This is a phased plan that procurement, IT, and operations can use to scope resources and set realistic timelines.
-
AI readiness audit (weeks 1–4): Assess data quality, ERP/WMS integration points, SKU portfolio complexity, and current policy performance. Output: a prioritized list of pilot candidates and a data-gap remediation plan. This phase often surfaces quick wins — SKUs where a simple policy change, not a model, fixes the problem.
-
Pilot design and data preparation (weeks 5–8): Select the pilot SKU cohort (start with AX-segment SKUs), extract and clean historical demand and lead-time data, define the cost parameters, and set up the measurement framework (holdout group, KPI baselines). Data engineering typically takes longer than expected — budget 60% of this phase for it.
-
Model development and offline testing (weeks 9–14): Train the forecasting and replenishment models on historical data. Run backtests against held-out periods. Validate that model recommendations would have outperformed the existing policy before going live. Check for data leakage (a model that “sees” future data during training will look great offline and fail in production).
-
Online pilot (weeks 15–22): Deploy recommendations to the pilot cohort alongside the holdout group. Planners review and can override recommendations. Log everything. Measure KPIs weekly. Expect a 2–4 week calibration period where the model adjusts to live demand patterns.
-
Scale and orchestration (weeks 23+): Expand to additional SKU cohorts and locations. Integrate model outputs into ERP replenishment workflows. Set up automated alerting and a model-monitoring dashboard. Establish a retraining cadence (monthly or triggered by drift detection).
Cost guidance: Discovery and pilot phases for a mid-size operation (500–5,000 SKUs, 2–10 locations) typically run in the range of a structured consulting engagement covering data engineering, model development, and integration work. Scale phases add infrastructure costs for model serving and monitoring. Cloud deployment costs vary significantly by data volume and retraining frequency.
Vendor red flags to watch for: no ability to export model recommendations to your ERP via API; no offline backtest results on your own data before contract signing; no explainability layer on recommendations; and no defined retraining process when demand patterns shift.
Common failure modes and how to avoid them
Most AI inventory projects that underperform share the same handful of root causes.
-
Decoupled forecasting and replenishment: Building a forecast model and a separate replenishment rule that does not use the forecast’s uncertainty output. Closed-loop systems where control outcomes feed back into the forecasting model are substantially more resilient to lead-time shifts and demand shocks. Fix: require end-to-end integration from day one of pilot design.
-
Black-box-only deployments: Models that output recommendations with no explanation. Planners override them constantly (and correctly distrust them), so the model never gets the adoption it needs to prove value. Fix: require an explainability layer — at minimum, the top three features driving each recommendation.
-
Insufficient ERP/WMS integration: Recommendations that live in a dashboard but do not flow into purchase orders or replenishment workflows. The model runs, planners ignore it, and the project is declared a failure. Fix: integration to the execution system is not optional; it is the definition of “deployed.”
-
Ignoring promotions and causal events: A model trained only on historical demand will systematically under-forecast during promotions and over-forecast after them. Fix: include a promotional calendar and event flags as model features from the start.
-
Hyperparameter overfit on historical data: A model tuned to look great on backtests but brittle on live data. This is especially common with DRL models trained without policy regularization. Fix: use a true holdout period (not used in any tuning decision) and monitor live performance weekly in the first month.
One pattern that prevents rollout failure: a governance change where a cross-functional team (supply chain, IT, finance) reviews model recommendations weekly during the first 60 days. This catches systematic errors early, builds planner trust, and produces the override log that makes the next model version better.
Recent research results: DRL, OR-guided hybrids, and what they mean for practitioners
The research frontier has moved fast. Here is what the most relevant recent work shows and what it means for a deployment decision.
Key findings:
- The systematic review of 87 articles confirms that hybrid methods (ML + RL, DL + OR) now dominate the high-performance end of the research literature. Pure rule-based and pure ML approaches are being outpaced.
- DRL applied to multi-echelon networks shows cost improvements of 16.4% in linear network structures, 11.3% in divergent networks, and 6.6% in general network configurations versus classical benchmarks.
- Policy regularization in DRL — encoding base-stock behavior directly into the training objective — reduces hyperparameter sensitivity, speeds convergence, and made a full production deployment at a major e-commerce platform viable. Without regularization, DRL models are often too brittle for live inventory environments.
- The OR-guided pretrain-then-reinforce framework is the most practically significant recent development for large-scale operations. By using OR-derived decisions to pretrain a deep model before RL fine-tuning, the approach combines structural correctness with AI adaptability. Field results from a JD.com collaboration: 5.27-day reduction in turnover days, 2.29% increase in in-stock rates, 29.95% decrease in holding costs.
- Scenario-based simulation for disruption-aware training is emerging as a necessary complement to standard demand-history training, particularly for operations exposed to supply-chain shocks.
Research results summary:
| Study / Approach | Key Metric | Reported Improvement |
|---|---|---|
| LSTM + Q-learning vs. MRP | Total cost | ~15.7% reduction |
| DRL, multi-echelon (linear network) | Cost vs. benchmark | 16.4% improvement |
| DRL, multi-echelon (divergent network) | Cost vs. benchmark | 11.3% improvement |
| OR-guided pretrain-then-reinforce (field) | Holding costs | ~29.95% reduction |
| OR-guided pretrain-then-reinforce (field) | Turnover days | 5.27-day reduction |
| OR-guided pretrain-then-reinforce (field) | In-stock rate | +2.29 percentage points |
Practical implication: for most operations starting a first pilot, a well-tuned probabilistic ML model (XGBoost or LightGBM with quantile outputs) will capture most of the available gain with the least implementation risk. DRL and OR-guided hybrids become the right choice when you have a complex multi-echelon network, a simulation environment, and a team capable of managing the training pipeline. The research supports a crawl-walk-run approach: start with ML forecasting, prove ROI, then layer in DRL or hybrid methods as data and capability mature.
What an AI readiness audit actually reveals
The gap between “we have data” and “we can run a model” is almost always wider than operations teams expect. An AI readiness audit closes that gap before you spend budget on model development.
An audit typically surfaces three things that are invisible until you look: data that exists in the ERP but is stored in a format the model cannot use (aggregated monthly buckets instead of daily transactions, for example), integration points that require custom middleware to connect the model to replenishment workflows, and a short list of pilot-ready SKU cohorts where the data is clean enough and the business impact large enough to produce a defensible result in 8–12 weeks.
Three concrete deliverables an audit provides:
- A data-gap report: which data assets are usable now, which need remediation, and what that remediation costs in time and effort
- An integration map: how model outputs connect to your ERP, WMS, and purchasing workflows, and where the technical debt sits
- A prioritized pilot candidate list: the 2–3 SKU cohorts or locations where an AI pilot will produce the clearest ROI signal fastest
A realistic audit-to-pilot timeline looks like this: four weeks of audit work, two weeks of data remediation on the highest-priority gaps, then an eight-week pilot on the selected cohort. That is a 14-week path from “we are evaluating AI” to “we have live results.”
Digitalfractal’s AI integration consulting for inventory operations
The fastest path from evaluation to a working inventory AI system is one where the audit, data engineering, model development, and ERP integration are handled by a team that has done it before, not assembled from scratch.
Digitalfractal’s AI Audit and Opportunity Assessment is built for exactly this starting point: supply-chain and inventory managers who know AI should be on their roadmap but need a structured, low-risk way to find out where to start and what it will actually cost. The engagement delivers a data-gap report, integration map, and prioritized pilot candidates within four weeks. From there, Digitalfractal’s AI integration consulting team handles model development, ERP/WMS integration, and the online pilot, with measurable KPIs agreed before work begins. Operations with 500 or more SKUs, multi-location networks, or persistent stockout-and-overstock problems are the best fit. Book the audit at Digitalfractal to get a scoped engagement within one business day.
Frequently asked questions
What is inventory optimization AI?
It is the use of machine learning, deep learning, and reinforcement learning to automatically generate optimal inventory policies: how much stock to hold, when to reorder, and how to allocate inventory across a network. It replaces static rules and spreadsheet formulas with continuously updated, data-driven recommendations.
Does the 80/20 rule still apply when using AI?
Yes, but AI extends it. AI-based segmentation adds demand variability (XYZ), lead-time risk, and substitution relationships, giving you a richer segmentation that improves both the pilot scope and the final policy design.
Can ChatGPT or general-purpose AI tools optimize inventory?
Not directly. General-purpose language models are not designed to ingest time-series demand data, run replenishment simulations, or output policy parameters. Inventory optimization requires purpose-built ML pipelines trained on your operational data. ChatGPT can help draft analysis frameworks or interpret results, but it is not a substitute for a forecasting and optimization system.
Will AI replace inventory control managers?
No. AI handles the computational work: pattern recognition, policy calculation, and alert generation. Inventory managers handle the judgment calls: supplier relationship context, strategic stock decisions, override authority, and the governance of the AI system itself. The role shifts from manual calculation to model oversight and exception management.
How long does it take to see results from an AI inventory pilot?
Most well-scoped pilots produce measurable KPI results within 8–12 weeks of going live, assuming data preparation is complete before the pilot starts. The full cycle from audit to live pilot results is typically 14–20 weeks.
What is the minimum data requirement to start?
At minimum: six months of daily or weekly demand history per SKU, lead-time records at the purchase-order line level, and unit cost and holding-cost data. Twelve to 24 months of history is better for seasonal items. Missing any of these requires remediation before model training begins.
Sources
- Canada’s AI-powered supply chains cluster (Scale AI)
- DeepStock: Reinforcement Learning with Policy Regularizations for Inventory Management
- A review of artificial intelligence in inventory management (systematic review, 2025)