
Best Practices for Logs, Metrics, and Traces

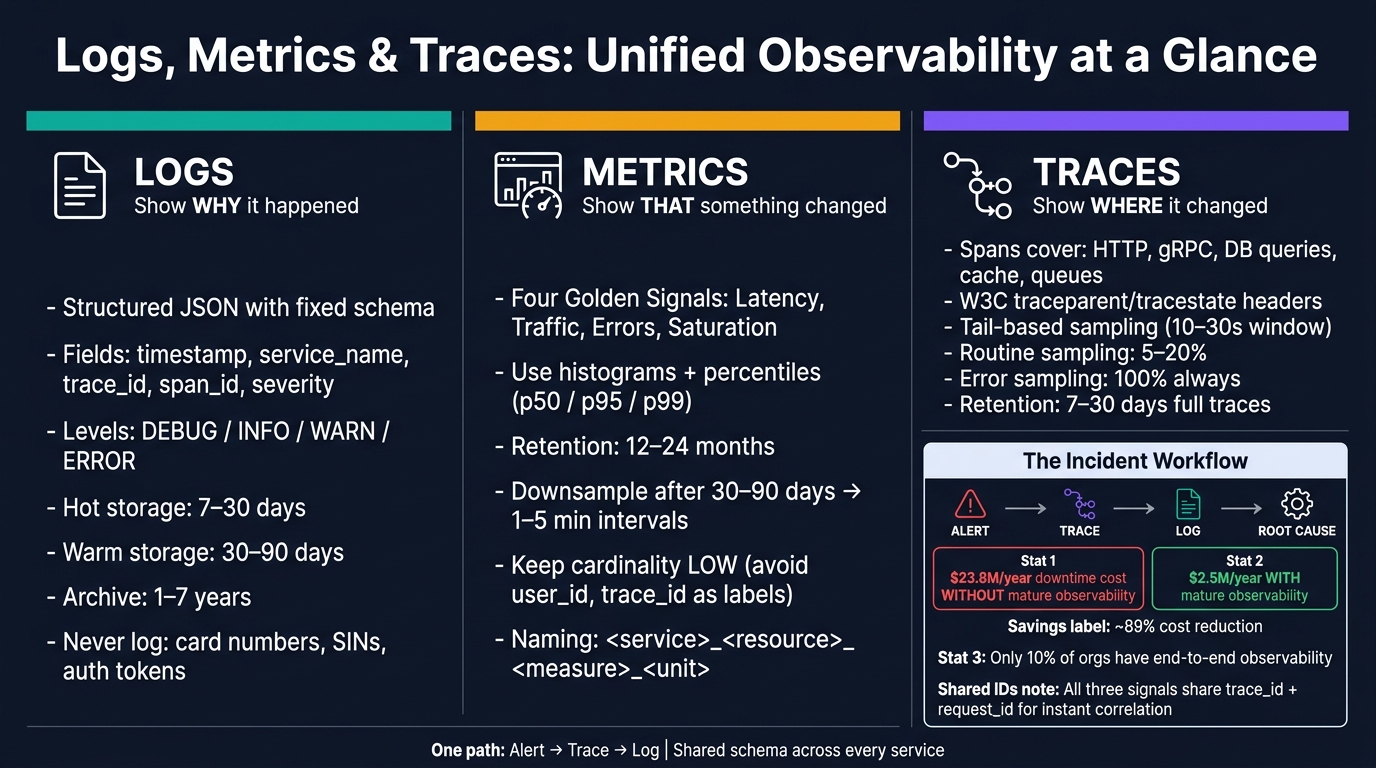
If I want faster incident response in microservices, I need all three signals working together: metrics show that something changed, traces show where it changed, and logs show why.
Done well, this cuts time spent guessing. It also helps control storage cost, supports audit needs, and keeps private data out of telemetry. This is a key part of a digital transformation roadmap for modernizing operations. The article’s main point is simple: use one shared schema, low-cardinality metrics, linked trace context, and clear retention and access rules.
Here’s the short version:
- Logs should be structured, searchable, and free of sensitive data
- Metrics should focus on latency, traffic, errors, and saturation
- Traces should follow each request across services and queues
- Correlation should let me go from alert → trace → log with the same IDs
- Governance should cover retention, access, redaction, residency, and overhead
A few numbers stand out:
- Mature observability teams cut downtime cost from $23.8 million per year to $2.5 million
- Only 10% of organisations report end-to-end observability across all components
- Full traces are often kept for 7–30 days
- Metrics are often kept for 12–24 months
- Routine trace sampling often sits around 5–20%, while errors should stay at 100%
In plain terms, I’d treat the setup like this:
- Metrics tell me when latency or error rate moves
- Traces point me to the slow service, database call, or queue step
- Logs give me the exact timeout, retry failure, or bad config behind it
That’s the workflow the article pushes: one path from alert to root cause, with clear fields, shared IDs, and tight data rules across every service.
Logs vs Metrics vs Traces: The Three Pillars of Observability
Observability Crash Course: Logs, Metrics, Traces Explained
sbb-itb-fd1fcab
Logs: Make Events Searchable, Consistent, and Safe
After a metric spike or a trace anomaly, logs should be the fastest path to the exact event. But that only works when logs are easy to search, written the same way every time, and kept safe.
Use Structured Logs with a Standard Schema
Use structured JSON logs with a fixed schema so every tool can filter, aggregate, and correlate entries without regex.
Each log entry should carry the same core fields. At a minimum, include:
- a
timestampin ISO 8601 format, such as2026-08-12T15:23:45.123Z service_nameenvironmentsuch asprod-ca-centralseverity- a short
message - correlation IDs:
trace_id,span_id, andrequest_id
When it helps, add business context too, like a hashed customer_id or an order_id. Those fields make queries much easier to run and much easier to trust.
Keep variable data out of the message text. That’s where teams often trip up. Instead of logging "Payment declined: insufficient funds for customer 4821", log message: "Payment declined" and put decline_reason: "insufficient_funds" plus customer_id_hash: "..." in separate fields. Now your dashboards and searches still work across thousands of entries instead of falling apart on slightly different wording.
Set Log Levels, Retention, and Sensitive-Data Rules
Clear level definitions solve two problems at once: too much noise and too many blind spots. Use these levels:
| Level | When to Use | Example |
|---|---|---|
| DEBUG | Targeted troubleshooting only – never left on cluster-wide | Verbose serialisation output during a specific bug investigation |
| INFO | Normal operational milestones | "Invoice generated", "Permit application submitted" |
| WARN | Unexpected events that self-recovered | "Timeout contacting payment gateway, retrying, attempt=2" |
| ERROR | Failures that affected users or data integrity | "Failed to persist invoice after 3 retries, amount=CA$129.99" |
For retention, a tiered setup keeps storage spend under control without making incident work painful. Keep fully indexed logs in hot storage for 7–30 days so teams can handle day-to-day incidents. Move older logs to warm storage for 30–90 days when you need trend analysis. Archive logs for 1–7 years in compressed object storage for compliance, especially for public sector records, health data, and financial transactions.
Sensitive data should never land in logs. Full payment card numbers, Social Insurance Numbers (SINs), authentication tokens, and unencrypted personal identifiers must stay out of every log entry. The safest approach is allow-listing: only log fields that are marked safe in advance. Trying to scrub unsafe data after it has already been written is a losing game.
When some visibility is needed, mask or tokenise the data. Log the last four digits of a card. Use an irreversible hash for a customer identifier. And don’t leave this to chance – enforce the rules in shared logging libraries and middleware so every service follows the same guardrails.
Centralise Logs Across Services and Infrastructure
Send logs from apps, containers, nodes, gateways, and managed services into one search system. If logs are scattered across places, incident response slows to a crawl.
A standard centralised setup uses lightweight collection agents, such as Fluent Bit, on each node to forward structured logs to a central store. An ingestion layer helps absorb traffic spikes without dropping data. Correlate by trace_id early in the pipeline so log search can follow a request end to end.
The central store should support full-text search and field-level filtering on fields like service_name and trace_id. It should also connect straight to dashboards and alerting, so an engineer can jump from a failing metric to the exact log entries without bouncing between tools.
Access matters too. Control it with role-based permissions and audit trails. And use the same trace_id and request_id across services so log search can follow a request from start to finish.
Metrics: Track Service Health with Alert-Ready Signals
Metrics show service health in real time. They also hint at drift before users start to feel it. That makes them a good fit for alerting and long-term trend analysis. The catch? Keep cardinality low, or your metric system can get expensive and messy fast.
Use metrics to spot regressions early and figure out where to dig next. Start with service-level signals. Then look at infra metrics to explain why something is going wrong.
Measure Latency, Traffic, Errors, and Saturation
Track the four golden signals: latency, traffic, errors, and saturation. Logs tell you what happened. These signals tell you whether the service is healthy enough to keep going.
| Signal | What to Measure | Example Metric |
|---|---|---|
| Latency | Request duration, including failures | http_request_duration_seconds (histogram) |
| Traffic | Requests, messages, or transactions per second | http_requests_total (counter) |
| Errors | Failure rate, timeouts, and application errors | http_errors_total / http_requests_total |
| Saturation | CPU, memory, queue depth, and pool usage | memory_used_bytes / memory_total_bytes |
Track these at both layers:
- Application layer: request rates, queue depth, and error codes
- Infrastructure layer: CPU utilisation, network throughput, and disk I/O
For a payments API, this means watching 5xx rates and checkout latency right beside pod memory usage and connection pool exhaustion. Incidents often begin in one layer and show up in the other. That’s why looking at only app metrics, or only host metrics, can leave you chasing shadows.
Use Histograms and Percentiles Instead of Averages
Averages can make a bad user experience look fine. Percentiles don’t. If a small group of users is stuck waiting forever, the average may barely move. p95 and p99 will show it right away.
Use histogram metrics with buckets that fit your service’s expected response times, then compute percentiles from those buckets. In Prometheus, that means using histogram_quantile() over http_request_duration_seconds_bucket.
A simple way to think about it:
- p50 shows the baseline experience
- p95 is a common SLO target for most services
- p99 is worth watching for high-value flows like login or checkout
Set SLOs in user terms, not system terms. For example: 95% of checkout requests under 300 ms over 30 days. The remaining 5% is your error budget – error_budget = 1 − SLO. Alert on sustained SLO burn, not one-off spikes. A short blip may look scary in a dashboard, but it’s sustained burn that tells you the service is drifting off course.
Control Metric Names, Labels, and Cardinality
Metrics are only useful when their names stay stable and their labels stay bounded. A simple naming pattern like <service>_<resource>_<measure> works well. Include units in the suffix too, such as auth_api_request_latency_seconds or payments_api_http_requests_total. Never mix units in the same metric family.
Labels make metrics far more useful to query, but they come with a price. Every new label value creates another time series. Labels like environment, region, and status_code are usually safe because the set of values stays small and steady. Labels like user_id or trace_id are a train wreck for storage. user_id alone can have cardinality in the billions.
High-cardinality labels drive up:
- time-series counts
- processing cost
- cloud spend
Keep that kind of detail in logs or traces, not in metrics.
Before you add a new label, estimate its cardinality. Multiply the number of expected distinct values by the number of current label combinations on that metric. If that total starts looking too large, zoom out a bit. Use customer segment instead of customer ID, for example, or move the detail into a log field. That small choice can save a lot of pain later.
Traces: Follow Requests Across Distributed Services
Metrics tell you that something went wrong. Traces help you see where it went wrong. As a request moves through APIs, databases, caches, queues, and outside services, traces show which dependency, hop, or query caused the spike. Each span records one timed step with a name, start and end time, status, and attributes.
Create Clear Spans for Important Operations
Use spans to mark the calls most likely to explain latency, retries, or failure chains. Put the focus on the operations that help most during diagnosis:
- inbound HTTP or gRPC requests
- outbound service calls
- database queries
- cache reads and writes
- message publish or consume steps
Span names should stay stable and low-cardinality. Good examples include GET /checkout, POST payment.authorize, or SELECT orders. Avoid raw IDs, full SQL strings, or framework method names, which tend to create noise and make traces harder to search.
Add a small, standardised set of attributes to each span. For HTTP, use http.method, http.route, and http.status_code. For databases, use db.system, db.name, and db.operation. For queues, use messaging.system and messaging.destination.
You can also attach business context, like an order ID, tenant, or region, but do that with care. Keep PII out of traces entirely. And keep span names low-cardinality so tracing overhead stays under control and search results don’t turn into a mess.
Propagate Trace Context Across Synchronous and Asynchronous Flows
Use the W3C Trace Context standard, especially the traceparent and tracestate headers, for HTTP and gRPC calls. Gateways, load balancers, and proxies should pass those headers along so the trace stays connected instead of breaking halfway through.
Async flows need the same treatment. When you publish a message or queue a job, inject trace context into message headers or the job payload. Then extract that context when processing starts. That’s what keeps the trace linked from end to end, even when work happens later or on another service.
Sample Traces Without Losing Critical Failures
Sampling should cut storage cost without throwing away the traces you need most during an incident. A good rule of thumb is simple: keep all errors and slow traces, then keep a small share of normal traffic.
Tail-based sampling works better when the keep-or-drop choice depends on how the full trace turns out. Head-based sampling makes that choice right at the start of a request, before you know whether it will fail or slow down. Tail-based sampling waits 10 to 30 seconds so enough spans arrive to judge the full trace.
That delay lets you apply rules like keeping all traces with an error status or latency above 500 ms. In plain terms, you hold onto the traces that are most useful for troubleshooting instead of filling storage with routine requests. Keep these sampling rules aligned with log and metric collection so correlation remains intact.
Unified Observability, Governance, and Operating Rules
Correlate Logs, Metrics, and Traces in One Workflow
Once you’ve captured each signal, the next job is getting them to work together inside one incident workflow. The goal is simple: move from an alert to the related trace, then straight to the exact log lines without bouncing between tools or guessing where to look.
That only works if your signals share the same IDs and labels. When logs and spans include the same trace_id and request_id, and metric alerts use matching service, environment, and region labels with exemplars that link back to a trace, an on-call engineer can start with a firing alert, jump to traces filtered by the same labels and time window, and then query the exact log lines for that request across the API gateway, auth service, billing service, and other dependencies with a query such as trace_id=abc123.
Your dashboards should show these links right where people need them. A metric chart should include a View related traces link. A trace view should include Open related logs. And the incident timeline should pull all three signals into one place. Put that workflow into your runbooks and incident playbooks so every team follows the same path during a production incident.
Standardise Instrumentation and Data Collection
After correlation is in place, the next step is standardising how every service emits telemetry. If each team names things differently or measures the same thing in different units, queries get messy fast.
OpenTelemetry helps here by giving you a shared service.name resource attribute across every service, keeping cross-service traces complete, and holding metric units steady – latency histograms in milliseconds, throughput in requests per second.
Set a baseline telemetry requirement that every service must meet before it goes to production. At a minimum, that should include:
- Request traces for all inbound HTTP and gRPC traffic
- Latency and error metrics for critical endpoints
- Structured logs that contain trace IDs
Enforce that baseline through CI checks and a service readiness checklist. If you operate in Canada, route telemetry from Canadian regions to Canadian collectors and storage, using tags such as deployment.environment=prod-ca and region=ca-central-1. Also map older telemetry to standard semantic fields so teams can run the same queries across services instead of translating field names every time.
Set Retention, Security, and Performance Guardrails
Governance is what keeps observability useful without turning it into a security, cost, or performance problem. Not all signals age the same way, so retention should match how each one is used.
Keep metrics for 12–24 months, and downsample high-resolution data to 1–5 minute intervals after 30–90 days. Retain complete traces for 7–30 days, then keep only aggregated statistics or selected samples. Logs usually work best with a hot-warm-cold model: 7–30 days in fast, searchable storage for active debugging, then 3–12 months in cold storage for compliance and audit needs.
Security rules matter just as much. Apply role-based access control so only authorised SREs and security analysts can access production logs and traces. Redact or tokenise sensitive fields at ingestion, and don’t store full payloads, credentials, payment card numbers, or other personal data in traces or logs. Encrypt telemetry in transit and at rest across all storage tiers. In Canada, privacy rules also mean keeping personal data in the right jurisdiction and limiting access, so your observability pipeline should enforce data residency and keep an audit trail of access.
On the performance side, keep instrumentation overhead low. Use async, batched telemetry export with backpressure handling. Limit DEBUG logging in production to short, time-boxed cases. Set sampling rates of 5–20% for routine traces while still capturing 100% of errors. And don’t ignore the observability stack itself – monitor internal metrics such as queue sizes, export latencies, and dropped spans, and keep the latency added by telemetry collection under 1–2 ms per request at peak load.
Conclusion: What Effective Observability Requires
Observability in microservices isn’t one tool, and it isn’t something you set up once and forget. It’s a working style teams build into how they write, deploy, and run web applications.
When that work is done well, diagnosis gets much faster: alert to trace to log, without guesswork. That’s the bar. From an alert, to a trace, to the exact log lines.
Core operating rules
Those results depend on a few non-negotiable operating rules:
- One schema for logs, metrics, and spans
- Golden signals with percentile-based alerts
- Trace context propagated everywhere
- Shared labels for correlation
- Strict retention, security, and residency guardrails – including redaction at ingestion, role-controlled access, and data residency aligned with Canadian privacy requirements
At 2:00 a.m., that’s the difference between guessing and fixing.
FAQs
How do I start with all three signals?
Start small. Instrument your highest-traffic user journeys first, then add all three signals so you can follow each request from start to finish.
Define what you want to measure with SLIs/SLOs first, such as p95 latency and error rates. Then log key events and tie them to traces, while using metrics for fast detection and trend analysis.
As your team learns what matters most, standardize your documentation and runbooks. That way, people aren’t scrambling when something breaks – they can see the issue, trace it back, and act with a clear playbook.
What should I never store in telemetry?
Never store sensitive information in telemetry. That includes API keys, passwords, credentials, and personal information.
Use dedicated secrets management tools, secure variables, and automated redaction to keep logs and traces clean, secure, and in line with privacy rules like PIPEDA.
How do I keep observability costs under control?
Keep costs in check by matching your base capacity to actual demand, setting conservative instance limits, and turning on auto-scaling so on-demand resources kick in only when traffic spikes. Reserved instances or savings plans can also cut cloud spend.
You can trim costs further with tiered storage, shorter retention for events that don’t need long-term replay, circuit breakers that curb wasted compute during outages, and centralized caching that takes pressure off your database.