AI Fuel Analytics: Test Trip Models in 90 Days for Fleets

AI-driven fuel analytics converts telematics and fuel-flow data into predictive models and prescriptive actions that typically cut fleet fuel use within months, not years. Fleet-wide deployments have reported savings in the mid-single digits, with some experimental results reaching into the double digits under controlled conditions, through methods like Fuel-Efficient Autonomous Driving and neural predictive control. This article walks through the data you need, the machine learning methods that work, the metrics that prove savings, and the rollout steps a fleet can start this quarter.
TL;DR:
- Reconcile fuel card purchases with telematics or ECU readings, and log every manual correction with its timestamp, reason, and responsible person.
- Set a baseline covering at least one full season, lock a comparable control group before launch, and adjust comparisons for route length, payload, and weather.
- FEAD reported 5.71% fleet average savings across 50 million kilometers, while experiments reached 15.51%; treat the latter as a best case, not a forecast.
- Start with GPS, OBD feeds, and reconciled fuel card history for a small vehicle group; measure results against controls during the pilot’s final weeks.
- Pair in cab alerts with post trip scoring and coaching; alerts alone can lose impact as drivers return to habitual behavior.
Table of Contents
- Telematics and data inputs: the sensors and feeds that power fuel analytics
- Driver behavior detection and coaching: from detection to sustained fuel savings
- Vehicle performance and predictive maintenance: spotting mechanical drivers of high fuel use
- Routing and dispatch optimization to cut wasted miles and inefficient stops
- Modeling and ML methods: trip-based models, NTM/NPC, NN-BSFC and explainable approaches
- Measuring savings and building an ROI case: metrics, pilot design, and reconciliation
- Implementation roadmap: data, people, architecture, and a 90-day pilot checklist
- How an AI Readiness Audit and pilot accelerates getting results
- Data preprocessing and integration challenges for fuel consumption analytics
- AI model validation techniques specific to fuel consumption prediction
- Impact of environmental factors on fuel consumption analytics
- Data security and privacy considerations in collecting vehicle and driver data
- Author perspective: three priorities fleet leaders should set this quarter
- Getting started: the AI Readiness Audit and pilot path
- FAQ
- Sources
Telematics and data inputs: the sensors and feeds that power fuel analytics
Every fuel analytics model is only as good as the data feeding it. A workable baseline combines a handful of sources, and skipping any one of them tends to introduce blind spots that show up later as unexplained variance in a fuel report.
The minimum viable stack includes:
- GPS and trip data: location, speed, elevation, and stop events that let you reconstruct a route and its grade profile.
- OBD/CAN bus feeds: engine RPM, throttle position, and diagnostic trouble codes that reveal how the engine is actually running.
- Fuel-flow meters or ECU fuel-rate signals: the most direct measure of consumption, when available on the vehicle.
- Fuel-card transaction data: purchase volume, location, and timestamp, used to reconcile what the ECU reports against what was actually paid for.
- Payload and weight data: load weight changes fuel burn substantially on grades and in stop-and-go traffic.
- Route and grade data: terrain affects consumption independently of speed or load.
- Weather feeds: wind, temperature, and precipitation all shift fuel demand for the same route and load.
Synchronizing these feeds is harder than it sounds. GPS pings might arrive every second while fuel-flow data samples every few seconds, and fuel-card swipes are logged once per fill-up with no granular timestamp alignment to a trip. A model trained on poorly synchronized data learns noise instead of signal. Common fixes include resampling to a common interval, forward-filling short gaps, and flagging (rather than silently interpolating) any gap longer than a defined threshold.
Reconciliation between fuel cards and telematics-reported consumption deserves particular attention. Natural Resources Canada’s Green Freight guidance treats manual fuel logging as error-prone and points fleets toward automated telematics with clear reconciliation and audit trails as a condition for credible measurement. In practice, that means every manual correction to a fuel record, whether it is a misattributed card swipe or a sensor dropout, should be logged with a timestamp, a reason, and the identity of who made the change. Analytics built on data nobody can audit will not survive scrutiny when you present a savings number to finance.
For fleets evaluating which telematics platform to instrument first, a comparison of fleet management software is a useful starting point before committing to hardware.
Driver behavior detection and coaching: from detection to sustained fuel savings
Vehicles burn fuel differently depending on who is driving them, and the gap between the most and least efficient driver on a route is often larger than any single mechanical fix could close. Machine learning models trained on telemetry classify driving events into categories that map directly to fuel waste: excessive idling, harsh acceleration, hard braking, and speed profiles that ignore upcoming grade or traffic.
A well-built behavior model does more than flag bad events. It separates events that were unavoidable, such as braking for a pedestrian, from patterns that repeat across a driver’s trips, such as consistently accelerating too hard out of stops. That distinction is what makes coaching credible instead of punitive.
- Idle detection: flags extended stationary periods with the engine running, often the single largest controllable waste category in urban routes.
- Harsh event scoring: aggregates hard-braking and rapid-acceleration counts per hundred miles for a comparable driver score.
- Speed-profile analysis: compares actual speed against an efficient profile for the same route and load.
Real-time alerts work for immediate correction, like a cab warning for harsh braking, while post-trip scoring supports coaching conversations and incentive design, where drivers see a weekly or monthly efficiency score tied to a specific program. Programs that combine both tend to hold their gains longer than real-time alerts alone, since drivers who only get in-cab warnings often revert once the novelty wears off.
Pro Tip: Measure behavior-coaching impact over a full seasonal cycle, not a single month, since weather and route mix can mask or exaggerate a driver’s real improvement.
Vehicle performance and predictive maintenance: spotting mechanical drivers of high fuel use
A driver cannot coach their way around a clogged fuel injector or a misaligned wheel. Analytics that track fuel-flow trends alongside diagnostic trouble codes (DTCs) and OBD parameters can surface mechanical faults long before they trigger a dashboard warning light, because fuel economy often degrades gradually before a sensor crosses its failure threshold.
- Fuel-flow trend monitoring: a gradual rise in liters per 100 kilometers on a stable route signals a developing mechanical issue.
- DTC correlation: cross-referencing trouble codes against fuel-consumption spikes helps rank which faults are actually costing fuel, not just triggering a warning.
- OBD parameter tracking: oxygen sensor readings, fuel trim values, and turbo boost pressure flag inefficiencies before they become breakdowns.
Manufacturer brake-specific fuel consumption (BSFC) maps, built in a lab under controlled conditions, describe how an engine should perform at a given load and RPM. The trouble is that real engines age, get recalibrated, and run in conditions the lab never tested. Fleet-specific calibration or neural-network-based BSFC models (nn-BSFC) trained on a fleet’s own operating data tend to track real-world fuel use more closely than a static factory map, because they absorb the actual wear and maintenance history of the vehicles they’re trained on rather than assuming factory-new performance.
Fleet benchmarking rounds out the picture: comparing fuel efficiency across vehicles of the same make, model, and route type isolates which units are underperforming their peers, which is a far more useful signal for prioritizing maintenance dollars than chasing every DTC as it appears. For fleets combining multiple sensor streams into one maintenance view, a technical resource on sensor data fusion covers how to combine those streams into a single maintenance-ROI picture.
Routing and dispatch optimization to cut wasted miles and inefficient stops
The shortest route on a map is not always the most fuel-efficient one. A route with less distance but steep grades, heavy stop-and-go traffic, or a string of traffic lights can burn more fuel than a slightly longer route with a steady speed profile. Energy-optimal routing accounts for terrain, expected traffic patterns, and speed variability, not just miles.
- Compare shortest-distance routing against energy-optimal routing for your highest-mileage lanes, using terrain and historical traffic data rather than distance alone.
- Consolidate loads and reduce empty miles by matching outbound and return trips wherever delivery windows allow.
- Dispatch toward preferred fuel stops that sit on or near the planned route instead of requiring a detour.
- Integrate routing logic with your transportation management system (TMS) and telematics feed so that a vehicle already in motion can receive a re-route when traffic or weather conditions change mid-trip.
The integration point matters as much as the algorithm. A routing engine that produces a theoretically optimal path is worthless if the dispatcher has to manually re-key it into the TMS, and real-time re-routing only works when the telematics feed and the TMS share a common data format and update frequency. Fleets that treat routing optimization as a standalone tool, disconnected from dispatch operations, tend to see the gains erode within a few months as drivers revert to habitual routes.
Modeling and ML methods: trip-based models, NTM/NPC, NN-BSFC and explainable approaches
Choosing the right modeling approach depends on what data you have and how much explainability you need. Manufacturer BSFC maps are a reasonable starting point but assume a static engine state that rarely matches a real, aging fleet vehicle. Data-driven neural trip models (NTM) and neural predictive control (NPC) approaches instead learn fuel behavior directly from historical trip data, which lets them adapt to vehicle aging, varied terrain, and driver-specific patterns that a lab-derived map cannot capture.
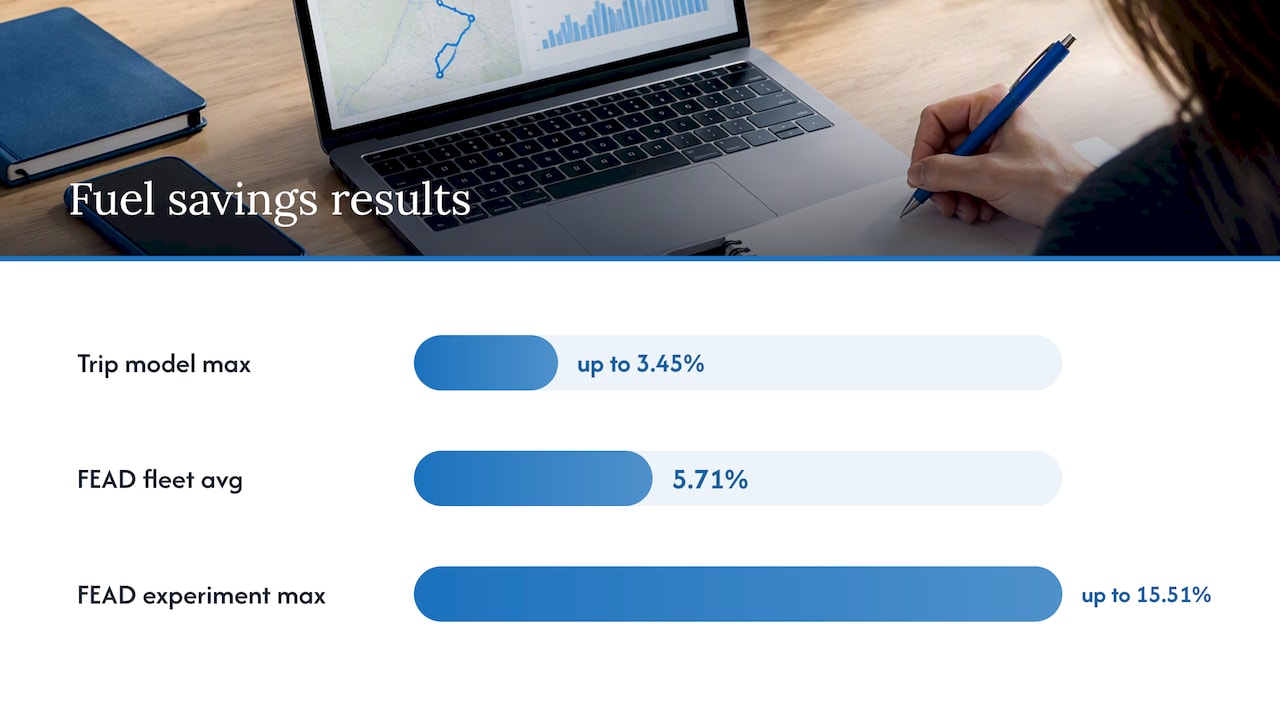
One data-driven approach reduced fuel consumption by up to approximately 3.45% versus a baseline predictive cruise control system in open-road testing, with the NVFormer neural predictive control study reporting robust performance across varied terrain when the model was trained on large historical datasets.
At larger scale, a Fuel-Efficient Autonomous Driving (FEAD) deployment covering a reported 50 million kilometers produced fleet-average savings of 5.71%, with specific experiments showing gains up to 15.51% against a baseline predictive cruise control system. Those figures illustrate the range you should expect between a conservative fleet-wide average and a best-case result under favorable conditions, not a number to promise upfront.
Academic trip-based modeling research reinforces the same pattern at a smaller scale: field studies in heavy-duty vehicle fuel consumption show that small per-trip improvements, when aggregated across an entire fleet, add up to meaningful fleet-level fuel reductions even when no single trip shows a dramatic change.
When choosing between model types, a few practical distinctions help:
- Explainable models (gradient-boosted trees, explainable boosting machines) make sense when you need to justify a maintenance recommendation or a driver coaching decision to a non-technical stakeholder.
- Deep learning approaches (neural trip models, transformer-based predictive control) tend to outperform explainable models on raw prediction accuracy when trained on large, diverse historical datasets, but their internal reasoning is harder to audit.
- Validation discipline matters more than model choice: use trip-level holdout sets that preserve route and duty-cycle diversity, and report mean absolute error in liters per 100 kilometers alongside percent error broken out by duty cycle, rather than a single aggregate number that can hide poor performance on specific route types.
Data-driven control methods also avoid a structural weakness of lab-derived BSFC maps: they don’t depend on a perfect model of the vehicle, which lets them generalize better across terrain types and as a vehicle ages, according to the NVFormer research cited above.
Measuring savings and building an ROI case: metrics, pilot design, and reconciliation
Before you can claim a savings number, you need a baseline that survives an audit. That starts with three core metrics: liters per 100 kilometers (or miles per gallon, depending on your fleet’s convention), total liters consumed over a comparable period, and the associated carbon dioxide equivalent emissions, since many fleet sustainability reports now require that figure alongside fuel cost.
- Establish a baseline period of at least one full season before any intervention, using reconciled fuel-card and telematics data rather than either source alone.
- Design the pilot with a control group of comparable vehicles that do not receive the intervention, so seasonal and route-mix effects don’t get misattributed to the analytics program.
- Normalize results for route length, payload, and weather before comparing pilot vehicles against the control group.
- Report savings with a confidence range, not a single point estimate, since fleet fuel data carries meaningful trip-to-trip variance.
A government case study illustrates how this plays out at scale. NRCan’s federal fleet work with Geotab’s EV Suitability Assessment used telematics data to identify vehicles suitable for replacement or electrification, projecting 536,000 liters saved and approximately $4.85 million in total cost of ownership savings once the approach scaled across agencies. The case underscores a point worth repeating: pilots frequently undercount savings unless fuel-card reconciliation is normalized for route length, payload, and seasonal effects, which is exactly why a matched-control design matters.
A simplified illustrative example shows how liters translate into dollars: say a fleet of 50 trucks each averages 35 liters per 100 kilometers and covers 120,000 kilometers per year, for a combined annual consumption of 2.1 million liters.
| Metric | Baseline measurement | Purpose |
|---|---|---|
| Liters per 100 km | Reconciled fuel-card and telematics average | Core efficiency benchmark |
| Total liters consumed | Sum over baseline period | TCO and budget input |
| CO2 equivalent emissions | Derived from total liters and fuel type | Sustainability reporting |
| Fuel-card vs. ECU variance | Percent difference between sources | Data-quality check |
Implementation roadmap: data, people, architecture, and a 90-day pilot checklist
A rollout that tries to instrument an entire fleet on day one usually stalls. The more reliable path starts narrow: pick a minimum viable dataset, a small group of vehicles, and a tight timeline, then expand once the pipeline proves itself.
The minimum viable dataset to start with includes GPS and OBD feeds from a subset of vehicles, reconciled fuel-card history for the same vehicles, and at least one season of historical trip data if it exists. Hardware-wise, prioritize OBD/CAN telematics devices and, where budget allows, dedicated fuel-flow meters on the highest-mileage vehicles first, since those units will show a measurable result fastest.
A typical architecture pattern moves data from edge devices (the telematics hardware) into a cloud ingestion layer, then into a structured data warehouse, and finally into a machine learning pipeline that retrains on a scheduled basis as new trip data accumulates, often complemented by services like an AI receptionist for contractors to streamline operational workflows. Keeping raw and reconciled data separate at the warehouse layer makes later audits far easier.
- Data engineer or analyst: owns ingestion, reconciliation, and the data-quality checks described earlier.
- Fleet operations lead: selects pilot vehicles and routes, and owns driver communication for any coaching program.
- ML or analytics lead: builds and validates the baseline model and reports results against the control group.
A 90-day pilot checklist with measurable deliverables typically looks like this: weeks 1 through 3 for data ingest and reconciliation setup, weeks 4 through 8 for baseline model training and dashboard build, and weeks 9 through 13 for pilot measurement against a control group and a final ROI estimate. A real-time logistics analytics pilot built on this same 90-day structure shows what a completed deliverable set looks like in practice.
Pro Tip: Lock your control-group vehicle list before the pilot starts, not after you see early results, since choosing a control group retroactively tends to bias the comparison toward whatever outcome looks best.
How an AI Readiness Audit and pilot accelerates getting results
Most of the steps above, from data inventory through pilot measurement, map directly onto a structured audit and pilot process rather than something a fleet needs to design from scratch. Our AI Readiness Audit starts with exactly the data inventory described in the roadmap above: cataloging what telematics, fuel-card, and maintenance data already exists, where it’s missing, and which quick-win use cases (idle reduction, route optimization, predictive maintenance) are achievable within a 90-day timeline.
A typical 90-day pilot following that audit delivers:
- A reconciled data pipeline connecting telematics, fuel-card, and maintenance feeds into one auditable source.
- A baseline fuel-consumption model trained on your fleet’s own historical data rather than a generic benchmark.
- A working dashboard showing per-vehicle and fleet-wide efficiency trends against the baseline.
- An ROI estimate translating projected fuel savings into dollar and emissions terms for your specific fleet.
We build every solution around a fleet’s actual workflows and existing systems rather than offering a generic package, which is why the audit comes before any commitment to a larger build. For fleets weighing the broader analytics landscape, an AI integration benefits analyzer can help frame what a fuel analytics pilot is worth before the audit even begins.
Data preprocessing and integration challenges for fuel consumption analytics
Raw telematics and fuel data rarely arrive clean. Timestamps drift between devices, GPS signals drop in tunnels or dense urban canyons, and fuel-card transactions sometimes get logged against the wrong vehicle when a driver swaps trucks mid-shift. Each of these problems, left unaddressed, degrades model accuracy in ways that are hard to diagnose after the fact.
Integration challenges compound the data-quality problem. A fleet might run telematics hardware from one vendor, a fuel-card program from another, and a maintenance management system from a third, none of which were built to share data natively. Building a pipeline that reconciles these sources into a single, consistent record requires mapping each system’s identifiers (vehicle ID, driver ID, timestamp format) to a common schema before any analysis can begin.
Missing-value handling deserves a deliberate policy rather than ad hoc fixes. Short gaps in GPS or OBD data can often be interpolated safely, but a gap longer than a few minutes should be flagged rather than filled, since silently interpolating across a long gap can manufacture a route or speed profile that never happened. Fleets that skip this step tend to discover the problem only when a model’s predictions diverge sharply from reality on specific vehicles.
AI model validation techniques specific to fuel consumption prediction
A fuel-consumption model that performs well on its training data can still fail badly in the field, which is why validation design matters as much as model selection. The most reliable approach uses trip-level holdout sets, meaning entire trips, not individual data points, are set aside for testing, so the model is evaluated on routes and conditions it has never seen rather than on data points from a trip it partially trained on.
Cross-trip testing, where a model trained on one set of routes is validated against a different set of routes with similar characteristics, helps confirm that a model generalizes rather than memorizing quirks of a specific lane. Reporting mean absolute error in liters per 100 kilometers, broken out by duty cycle (highway, urban, mixed), gives a more honest picture than a single aggregate accuracy number, since a model can perform well on highway trips while missing badly on stop-and-go urban routes.
Seasonal validation matters too. A model validated only on summer data may perform poorly once winter driving conditions, cold starts, and reduced tire pressure change the underlying fuel-consumption pattern, so a full annual cycle of validation data gives a far more trustworthy result than a few months.
Impact of environmental factors on fuel consumption analytics
Weather and traffic conditions shift fuel consumption independently of anything a driver or dispatcher controls, and a model that ignores them will misattribute environmental effects to driver behavior or vehicle condition. Headwinds increase aerodynamic drag and fuel burn on highway routes, while cold temperatures raise fuel consumption through longer engine warm-up periods and increased rolling resistance from cold tires.
Traffic conditions matter just as much. Stop-and-go congestion burns more fuel per kilometer than steady-speed driving, even over an identical route, because repeated acceleration from a stop is one of the most fuel-intensive driving events there is. A fuel analytics model that incorporates real-time or historical traffic data for a given route and time window can separate congestion-driven consumption increases from genuine driver inefficiency or mechanical issues.
Building weather and traffic data into the model isn’t optional for credible results: without it, a fleet operating primarily in a cold climate or a congested urban corridor will always look less efficient than a fleet operating in mild weather on open highways, regardless of actual driver or vehicle performance.
Data security and privacy considerations in collecting vehicle and driver data
Telematics and fuel analytics programs collect data that ties directly back to individual drivers, including location history, driving behavior scores, and sometimes biometric data from in-cab monitoring systems. That data carries real privacy weight, and handling it responsibly means more than just encrypting a database.
Access controls should limit who can view individual driver-level data versus aggregated fleet-level trends, since a driver coaching program built on fine-grained surveillance tends to erode trust faster than it improves fuel economy. Clear policies on data retention, meaning how long raw GPS and behavior data are kept before being aggregated or deleted, matter both for privacy and for storage cost.
Any fleet collecting driver-level behavioral data should also be transparent with drivers about what is collected and how it’s used in coaching or performance evaluation, since a program perceived as covert surveillance generates resistance that undermines the entire effort. Data security practices, including encrypted transmission from telematics hardware and audited access logs, protect both driver privacy and the integrity of the fuel-consumption records you’ll eventually use to justify an ROI claim.
Author perspective: three priorities fleet leaders should set this quarter
Most fleets chasing fuel savings reach for a dashboard before they fix their data. That’s backward. A model trained on reconciled, audited data will outperform a flashier tool fed inconsistent inputs every time.
Set three priorities this quarter: first, reconcile fuel-card and telematics data and fix the gaps before building anything predictive. Second, start a pilot scoped to a handful of vehicles rather than the whole fleet. Third, insist on a control group from day one, not after you like the early numbers.
— Souhail
Getting started: the AI Readiness Audit and pilot path
Everything in this article, from telematics reconciliation to pilot design, is exactly what our AI Readiness Audit is built to assess. For current pricing details, please visit our website. The audit maps your existing data sources, flags the quick-win use cases your fleet can act on first, and sets up a 90-day pilot that delivers a reconciled pipeline, a baseline model, a working dashboard, and an ROI estimate built on your own fleet’s numbers.
We build every pilot around your existing systems and workflows rather than a generic template, aiming for a measurable result inside that 90-day window. If your fleet already has telematics in place but no clear picture of where fuel is actually being lost, the audit is the fastest way to find out. Start with an AI Readiness Audit to get a scoped plan for your fleet.
FAQ
Will AI ever be energy efficient?
AI models used for fuel analytics are generally designed to reduce energy consumption in the systems they monitor, such as a fleet’s fuel use, even though running the models themselves consumes some computing energy. The IEA’s reporting on AI for energy optimization notes that AI can improve operational decision-making across sectors including transport, which generally outweighs the computing cost for fleet-scale applications.
How do you measure fuel consumption?
Fuel consumption is typically measured in liters per 100 kilometers or miles per gallon, calculated from reconciled fuel-card purchase data and telematics or ECU fuel-flow readings. Comparing these two sources against each other is a standard way to catch data errors before using the numbers for analysis or reporting.
What is SFC in engine terms?
Specific fuel consumption (SFC), often expressed as brake-specific fuel consumption (BSFC), measures how much fuel an engine burns to produce a given unit of power output. Manufacturer BSFC maps are built in controlled lab conditions and can diverge from real-world performance as an engine ages, which is why fleet-specific or data-driven models tend to track actual consumption more closely.
What is a fuel monitoring system?
A fuel monitoring system combines telematics hardware, such as GPS and OBD/CAN devices, with fuel-flow sensors or ECU data to track how much fuel a vehicle consumes over time and under what conditions. NRCan’s Green Freight program defines eligible telematics devices for this purpose and has offered funding support, including 50% funding up to specified caps per eligible device, to help fleets adopt this hardware.
Sources
- Neural Predictive Control (NVFormer) — arXiv preprint
- Fuel-Efficient Autonomous Driving (FEAD) — ResearchSquare preprint
- Case study: NRCan uses telematics and EVSA (Geotab)
- AI for energy optimisation and innovation — IEA