90 Day AI Pilot to Prove ROI from Logistics KPI Dashboards

Every AI-enhanced logistics KPI dashboard needs to surface transport, warehouse, cost, exceptions, customer experience, and utilization metrics in one view. The single capability that separates a modern dashboard from a static reporting tool is real-time predictive alerting: catching a delay or SLA breach before it hits a customer. The sections below show how to pick the right metrics and turn those signals into action.
TL;DR:
- Test predictive alerts against at least 90 days of historical exceptions, checking precision and recall; keep people responsible for customer commitments and contract decisions.
- Connect TMS, WMS, telematics, carrier APIs, and ERP through feeds with minimal delay, shared identifiers, and consistent time zones before enabling live alerts.
- Give each alert tier an owner and response deadline, automate routine rebooking, and send customer or financial risks to a person for review.
- During a pilot lasting 90 days, establish a baseline, add quick win alerts, then compare accuracy, dispatcher time saved, and avoided incident costs against baseline.
Table of Contents
- Essential KPIs Every Logistics Dashboard Should Track
- What AI Actually Adds to a KPI Dashboard
- Connecting the Data: Systems and Quality Checks
- Designing Dashboards People Actually Act On
- Turning Alerts Into Owned Actions
- A 90-Day Pilot Playbook That Proves ROI
- Where Logistics KPI Tracking Is Headed
- How We Help You Build This Without Starting From Scratch
- FAQ
- Sources
Essential KPIs Every Logistics Dashboard Should Track
A dashboard only earns its place on someone’s screen when each number drives a decision. Transport metrics tell you whether to switch carriers or reroute a load. Warehouse metrics tell you when to add a shift. Cost metrics tell you whether a lane is still profitable. Group them by function instead of dumping everything into one grid, and each team can scan their own corner without wading through noise.
A practical shortlist that shows up repeatedly in logistics dashboard guidance includes:
- On-time delivery rate: flags carrier performance issues before a contract renewal.
- Average transit time: signals when a route or mode needs rework.
- Failed delivery rate: points to address data problems or last-mile capacity gaps.
- Cost per completed delivery: shows whether volume growth is actually profitable.
- Warehouse order-cycle time: tells you when to add staffing or rebalance picking zones.
- Exception volume: surfaces recurring friction points, like a dock that always backs up on Mondays.
Each of these should map directly to a decision: reroute, restaff, renegotiate, or investigate. A KPI that doesn’t change what someone does next is just decoration.
What AI Actually Adds to a KPI Dashboard
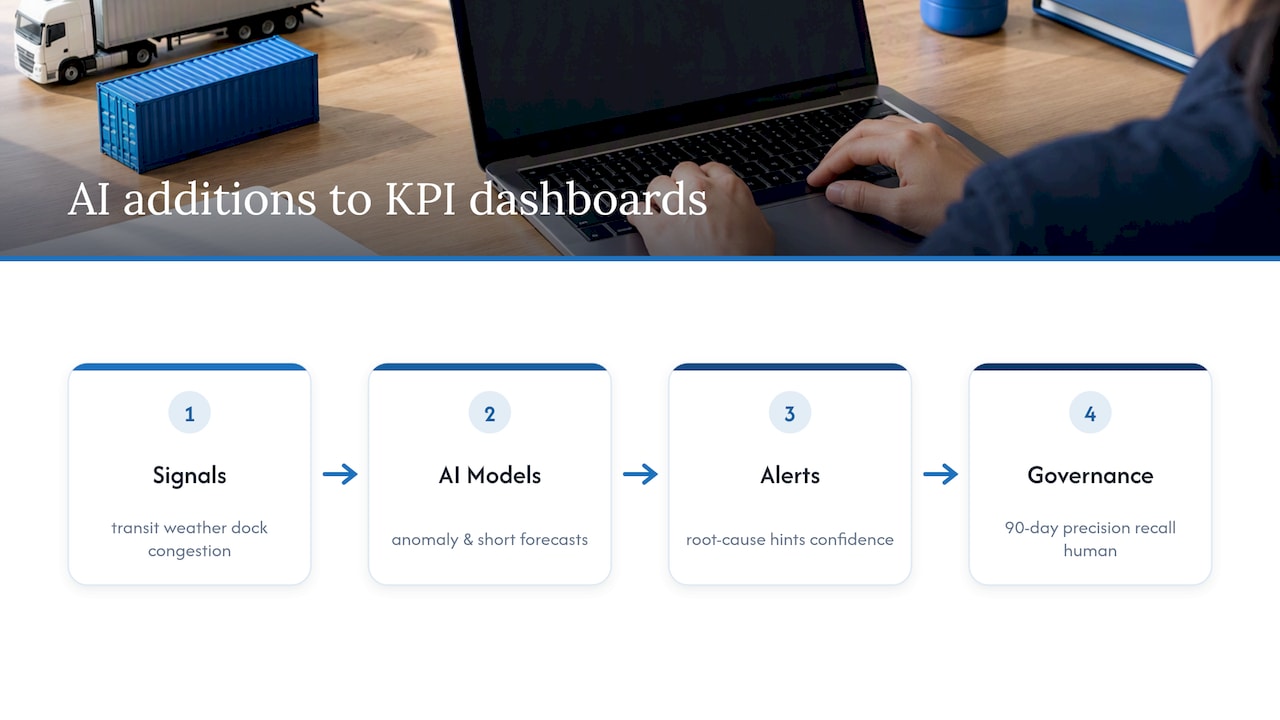
A static dashboard tells you what happened. An AI-enhanced one tells you what’s about to happen and why. Anomaly detection is the clearest example: if a carrier’s average transit time on a lane jumps outside its normal range, the system flags it before the shipment misses its window, instead of waiting for a customer complaint.
Short-horizon forecasting extends that further by predicting SLA breaches hours ahead, based on current transit patterns, weather, or dock congestion, giving dispatch enough lead time to reroute. The better systems also attach root-cause hints and confidence scores to each alert, so a dispatcher sees not just “delay likely” but “delay likely, high confidence, linked to carrier X’s last three loads on this lane.” That context cuts down on the guessing that causes alert fatigue.
Vetting these outputs matters as much as the features themselves. Gartner’s supply chain analytics guidance points to checking precision and recall against historical incidents before trusting an alert feed, since a system that cries wolf gets ignored within a week. Keep a human in the loop for anything that touches customer commitments or contract terms.
Pro Tip: Test any AI alert feature against at least 90 days of historical exceptions before rolling it out; if it would have missed the incidents you already know about, it needs tuning first.
Connecting the Data: Systems and Quality Checks
An AI model is only as good as the data reaching it, and in logistics that data lives in a scattered set of systems. Before adding predictive features, get the pipes connected and the data clean.
- Connect your TMS, WMS, telematics, carrier APIs, and ERP first, since these cover the bulk of transport, warehouse, and cost signals.
- Prioritize low-latency event feeds over batch exports, since a dashboard that refreshes once a day can’t support real-time alerts.
- Standardize canonical keys (shipment ID, order ID, carrier code) across systems so a single load doesn’t fragment into three unrelated records.
- Timestamp every event consistently, including time zone, since transit-time math breaks silently when timestamps drift.
- Start with five high-impact metrics rather than connecting everything at once; a clean signal on a handful of KPIs beats a noisy feed across twenty.
Running a quick audit of these five checkpoints before launch catches most of the data-quality problems that later show up as false alerts or mistrusted dashboards.
Designing Dashboards People Actually Act On
The best dashboard layout mirrors how someone makes decisions, not how the data happens to be structured. Put top-line KPIs (on-time rate, cost per delivery) on the landing view, and let operational tiles (today’s exceptions, at-risk shipments) sit one click away through drilldowns. A dispatcher and a finance lead need different starting points even when they’re looking at the same underlying data, so role-based views matter more than a single master screen.
A few visualization choices make the difference between a dashboard people check and one they ignore:
- Sparklines for trend lines, so a reviewer can spot drift without reading ten data points.
- Heatmaps for exceptions, making it obvious which lane or dock is the recurring problem.
- Consistent thresholds and colors across every view, so red always means the same thing.
- Mobile-ready layouts for dispatchers triaging an incident from a phone, not a desk.
Design for the three-second glance test: if someone can’t tell what needs attention in three seconds, the layout needs rework, not more data.
Turning Alerts Into Owned Actions
A signal that nobody owns is just noise with a timestamp. Every alert tier needs an assigned owner and a response SLA, so “high confidence delay, carrier X” has a name attached and a clock running, not an inbox it sits in.
- Define severity tiers: critical (customer-facing SLA at risk), moderate (internal process delay), and informational (worth tracking, no action yet).
- Automate the repeatable fixes, like rebooking a failed delivery slot, and route anything with financial or customer impact to a human first.
- Track mean time to respond, percent auto-resolved, and false-positive rate as your operational scorecard for the whole alerting system.
An AI scheduling agent built for logistics dispatch is one example of where automation handles the routine rebooking while a dispatcher reviews anything flagged as high-impact.
Pro Tip: If your false-positive rate climbs above what dispatch can tolerate in a shift, tighten the confidence threshold before adding more alert categories.
A 90-Day Pilot Playbook That Proves ROI
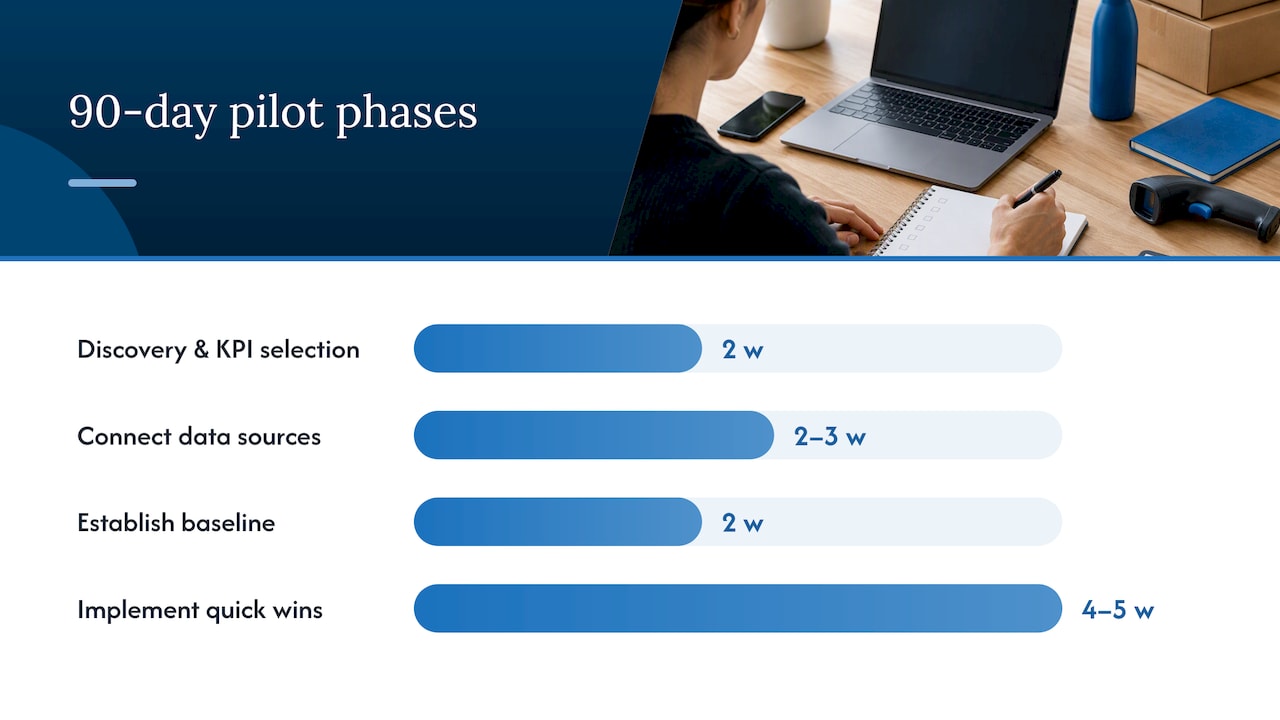
A pilot works best when it’s scoped tightly enough to measure and short enough to keep momentum. A typical 90-day structure breaks into five phases: two weeks of discovery and KPI selection, two to three weeks connecting data sources, two weeks establishing a clean baseline, four to five weeks implementing quick wins like automated alerts, and a final stretch measuring results against the baseline.
What to measure during that window:
- Signal quality: how many alerts were accurate versus noise.
- Time saved: hours dispatchers spent on manual tracking before versus after.
- Incident costs avoided: missed SLAs or failed deliveries caught early enough to fix.
A 90-day pilot case built around real-time logistics analytics follows this structure, and the AI ROI benchmarks by industry give a useful reference point for what payback looks like across sectors.
Where Logistics KPI Tracking Is Headed
The direction is clear: dashboards are moving from monthly reports toward real-time control towers, and agentic AI that doesn’t just flag a problem but proposes or executes a fix is gaining ground. The 2025 MHI and Deloitte report projects AI adoption in supply chain rising from 28% in 2024 to 82% by 2029, a pace that will outrun teams without solid data governance. My advice: pilot small, measure honestly, and only scale what the data actually proves out.
— Souhail
How We Help You Build This Without Starting From Scratch
We run audits specifically to shortcut the groundwork covered above: mapping which systems you already have, where the data gaps sit, and which KPIs would move fastest with AI-enhanced alerting. From there, a 90-day pilot approach turns that audit into working signals and early automations instead of a slide deck.
What that typically looks like in practice:
- Audit phase: review your TMS, WMS, and carrier feeds against the integration priorities we outlined here.
- Pilot phase: stand up alerting on a handful of KPIs, validate accuracy, and measure time saved.
- Handoff: a scoped plan for automating the repeatable responses, built around workflows rather than a generic template.
If you’re ready to see where your own data stands, start with our AI Readiness Audit.
FAQ
What are the KPIs for logistics?
The core categories are transport performance (on-time rate, transit time), warehouse efficiency (order-cycle time), cost (cost per delivery), exceptions, customer experience, and asset utilization. Most teams start with five to seven of these before expanding further.
What is the best AI for logistics?
There’s no single best system since it depends on your existing TMS, WMS, and data maturity. The more useful question is which features matter most for your operation, such as anomaly detection or predictive SLA alerts, and whether a vendor’s outputs hold up against your own historical incidents.
How do I create a KPI dashboard?
Start by connecting your core systems (TMS, WMS, telematics, carrier APIs), choosing five high-impact metrics with clean data, and building role-based views so dispatchers and managers see what’s relevant to them. Add predictive alerting once the baseline data is reliable, not before.
What are the 7 pillars of logistics?
Definitions vary across sources, but a common version covers order processing, inventory management, warehousing, transportation, packaging, information flow, and customer service. These pillars roughly map to the KPI categories a dashboard should track, from transport performance to service levels.
Sources
- New MHI and Deloitte Report Focuses on Orchestrating End-to-End Digital Supply Chain Solutions
- Gartner — Supply chain analytics