Sensor Data Fusion: Turning Signals Into Maintenance ROI

Sensor data fusion combines vibration, thermal, acoustic, and operational data with business context to produce maintenance signals accurate enough to act on, not just monitor. Enterprises running the strategy well see real gains: one offline fusion framework for offshore rotating equipment improved maintenance KPIs by 15 to 20 percent versus single-sensor monitoring.
If you run maintenance or reliability for a fleet, a construction site, or a processing facility, the immediate next step isn’t buying a platform. It’s running a focused audit: map your failure modes, check your data readiness, and pick one pilot asset that will prove the model before you scale it.
A few numbers worth anchoring on before you go further:
- 15 to 20 percent KPI improvement from fused vibration/ultrasound/temperature monitoring on real offshore platform data
- 34 percent reduction in unplanned downtime documented in an 18-month heavy-equipment case study
- Predictions only create value once they route into your CMMS and ERP as work orders, not dashboards nobody checks
Key Takeaways
Sensor data fusion turns multi-modal signals into actionable maintenance decisions only when paired with a pilot-first rollout and a real CMMS integration path.
| Point | Details |
|---|---|
| Start with an audit, not a model | Map failure modes and data readiness before selecting any sensor or algorithm. |
| Multi-modal fusion cuts false positives | Combining vibration, thermal, and acoustic data catches failures single sensors miss. |
| Expect 15 to 34 percent KPI gains | Documented case studies show downtime, cost, and accuracy improvements in that range. |
| Integration is the real bottleneck | A unified data layer connecting OT sensors to CMMS and ERP determines whether predictions get acted on. |
| Digitalfractal’s AI Readiness Audit | Recommended starting point for enterprises scoping a pilot-first predictive maintenance program. |
Table of Contents
- What Does Sensor Data Fusion Deliver for Predictive Maintenance?
- How Do You Move From Pilot to Enterprise Scale?
- What Architecture Actually Supports Sensor Fusion at Scale?
- How Do You Turn Raw Sensor Streams Into Model-Ready Data?
- Should You Use an Interpretable Health Index or a Deep Learning Model?
- What Governance Keeps Fused Data Reliable in Production?
- How Do You Evaluate a Sensor Fusion Partner or Vendor?
- What ROI Can You Realistically Expect?
- What Does a Realistic Timeline and Budget Look Like?
- Why Pilot-First Beats Model-First, Every Time
- Get a Clear Picture of Your Data Before You Commit to a Platform
- Sources
What Does Sensor Data Fusion Deliver for Predictive Maintenance?
A single vibration sensor tells you a bearing is running rough. It doesn’t tell you whether that roughness comes from misalignment, lubrication failure, or a thermal event three steps upstream. Sensor data fusion closes that gap by correlating multiple signal types against the same timeline, so the system flags a problem earlier and with far less noise.
The payoff shows up in three places: earlier detection, fewer false alarms, and more lead time to schedule a repair instead of reacting to a failure. That lead time is the entire economic case for predictive maintenance. A crew that gets two weeks’ notice can order parts and schedule downtime during a planned window. A crew that gets two hours’ notice eats an unplanned outage.
Fusion improvements measured across recent industrial studies:
A multi-modal predictive system for a 150-excavator construction fleet reduced unplanned downtime by 34 percent and cut maintenance costs by 28 percent over an 18-month deployment. An offline framework combining vibration, ultrasound, and temperature data on oil and gas rotating equipment produced a 15 to 20 percent KPI lift against conventional maintenance strategies.
Three enterprise scenarios show the pattern clearly:
- Logistics fleets: engine health sensors paired with telematics and brake monitoring catch degrading components before they strand a truck mid route.
- Construction equipment: vibration and thermal fusion across an excavator or crane fleet spots hydraulic and drivetrain issues that a single accelerometer alone would miss.
- Oil and gas rotating equipment: vibration, ultrasound, and temperature together separate a normal thermal cycle from an actual bearing failure, which single-sensor thresholds routinely get wrong.
Relying on one sensor type creates blind spots because different failure modes surface in different signal domains at different stages of degradation. Multi-modal fusion catches a failure whether it announces itself as heat, noise, or vibration first, and that redundancy is what drives the false-positive rate down.
How Do You Move From Pilot to Enterprise Scale?
Enterprises that treat predictive maintenance as a lifecycle rather than a model-buying decision get to production faster. The pattern that works, documented across recent industrial deployments, runs in four phases.
- Audit (typically 2 to 4 weeks): Map failure modes for your critical assets, inventory existing sensors and data quality, and identify integration gaps with your CMMS and ERP. This is where an AI Readiness Audit earns its cost, because it stops teams from building models on data that can’t support them.
- Pilot (typically 6 to 12 weeks): Select one asset class, instrument it if needed, and build a fused health index or model against a defined success metric, not a vague “see what happens” scope.
- Validate (typically 4 to 8 weeks): Run the pilot against real operating conditions and compare its alerts to actual maintenance events. Acceptance criteria should be explicit: precision, recall, and lead time targets, not just “the dashboard looks good.”
- Scale: Once the pilot clears its acceptance bar, extend the same integration pattern to additional asset classes or sites, reusing the data pipeline rather than rebuilding it.
Pro Tip: Pick your pilot asset based on the combined impact of failure frequency and downtime cost rather than sensor count alone. Focus on critical assets where fixing issues can demonstrate program value clearly.
What Architecture Actually Supports Sensor Fusion at Scale?
A production-grade setup has five layers: edge collection, a gateway, a unified data layer, a feature store or model runtime, and a two-way connection into CMMS and ERP systems. Skipping the middle layer is the single most common reason PdM pilots never scale.
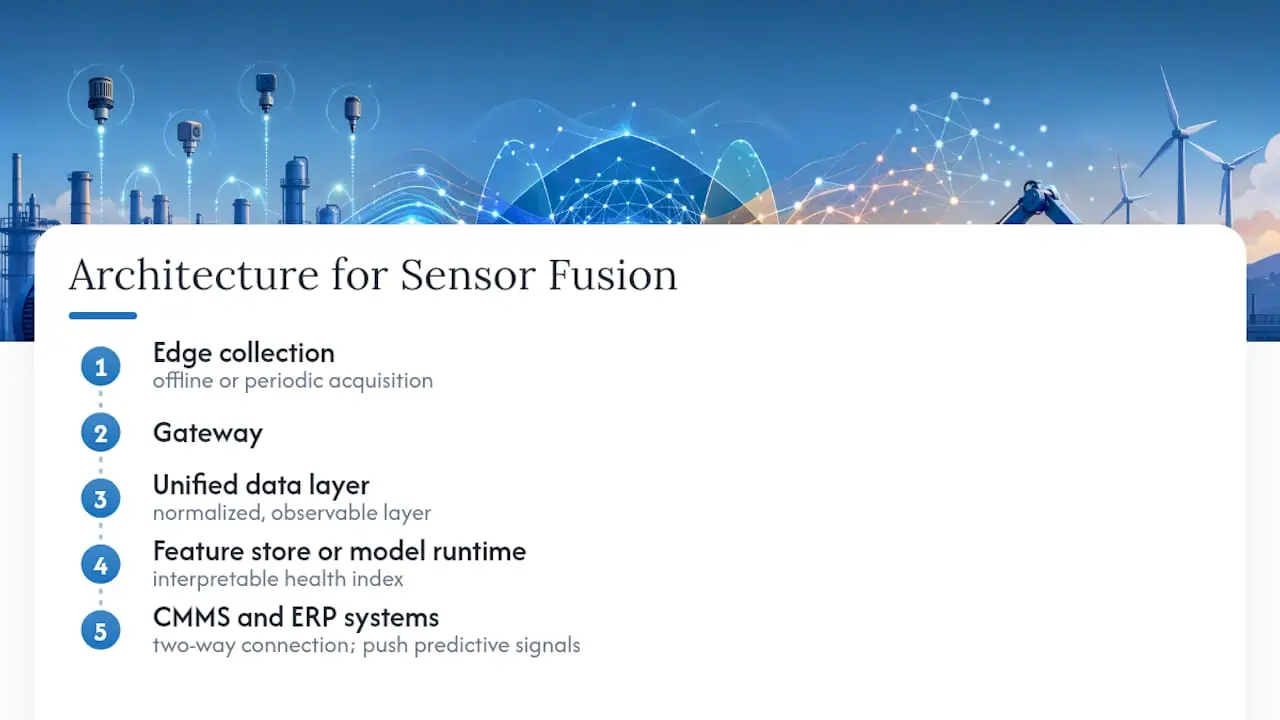
Data integration is the real bottleneck in most predictive maintenance programs, not model accuracy. Sensor and OT data, ERP context, and CMMS maintenance history all need to land in a normalized, observable layer before any model can be trusted. An iPaaS approach handles connector sprawl, schema normalization, and the lineage tracking you need when a model starts drifting and you have to figure out why. This same integration work is what lets predictive signals flow directly into scheduling systems instead of sitting in a report nobody opens.
Edge versus cloud comes down to latency, connectivity, and where the asset physically lives. A processing plant with a stable network can stream continuously to the cloud. A remote drilling platform or a pipeline running through low-connectivity terrain often needs offline or periodic acquisition, with edge inference running the interpretable health index locally and syncing summaries when a connection is available.
Pro Tip: Whatever schema you build, make timestamps, asset IDs, and operating-mode tags mandatory fields from day one. Retrofitting them after six months of data collection is expensive, and models trained without operating-mode context will confuse a normal startup vibration spike with a real fault.
How Do You Turn Raw Sensor Streams Into Model-Ready Data?
Fusion doesn’t happen automatically just because you’ve plugged in more sensors. It requires a preprocessing sequence, and skipping steps is the fastest way to end up with a model that looks good in testing and fails in production.
- Ingestion and time alignment: synchronize every sensor stream to a common clock before anything else.
- Resampling: convert mismatched sampling rates (a vibration sensor at 1 kHz, a temperature probe at 1 Hz) to a shared frequency.
- Outlier detection and missing-value handling: decide upfront whether gaps get interpolated, flagged, or excluded, because silent gap filling corrupts correlation analysis downstream.
- Denoising: filter sensor noise without stripping the subtle signal that precedes failure.
- Z-score normalization: put every sensor on a comparable scale so no single input dominates a fused index just because its raw units are larger.
- Correlation validation: confirm sensors that should move together actually do, catching wiring errors and sensor drift before they poison a model.
A practical pipeline looks like: sync timestamps, apply z-score normalization per sensor, run a correlation check across sensor pairs, aggregate into feature groups, then compute a fused health index. This sequence mirrors the approach validated in offline fusion research for rotating equipment, and it works whether you’re building a rules-based index or feeding a neural network.
Pro Tip: Before training anything, build a Pearson correlation matrix across your sensors and replay a known historical failure event through your pipeline. If the fused signal doesn’t spike where you know a failure occurred, fix the pipeline before you touch the model.
Should You Use an Interpretable Health Index or a Deep Learning Model?
You have two workable tracks, and the right one depends on your data volume and how much your maintenance team needs to trust the “why” behind an alert.
Track A builds a transparent fused health index with thresholded rules. It’s auditable, easy to explain to a plant manager, and works with smaller datasets. Track B uses machine learning models, ranging from random forests to LSTM/GRU networks to attention-based CNN-GRU architectures, for higher predictive accuracy at the cost of more data and more opacity. An attention-enhanced CNN-GRU model tested on multi-modal sensor data achieved strong classification accuracy while using its attention weights to show which sensor signals drove each prediction, closing part of the interpretability gap.
| Approach | Data needed | Interpretability | Edge suitability |
|---|---|---|---|
| Rules-based fused health index | Low to moderate | High, fully auditable | Excellent |
| Random forest / ensemble | Moderate | Moderate, via feature importance | Good |
| LSTM/GRU | High | Low without added tooling | Limited |
| Attention CNN-GRU | High | Moderate, attention maps aid explanation | Requires cloud or strong edge compute |
There’s no single fusion method that fits every IIoT deployment. Model-based, knowledge-based, and data-driven approaches each trade off differently on explainability, data hunger, and deployment cost, so the right pick depends on your asset criticality and how much historical failure data you actually have.
Pro Tip: If you deploy an attention-based model, surface the feature-importance output directly in the maintenance ticket. A technician who sees “vibration at 2x rotational frequency drove this alert” trusts and acts on it far faster than one who just sees a red flag.
What Governance Keeps Fused Data Reliable in Production?
A model that worked at pilot launch will drift. Sensors degrade, operating conditions shift, and equipment gets modified. Without governance, your fused predictions quietly become less trustworthy and nobody notices until a missed failure proves it.
- Build data-quality dashboards that alert on stalled feeds, schema changes, or sensor dropout, not just model output anomalies.
- Set explicit retraining triggers tied to accuracy decay, not a fixed calendar schedule.
- Run new model versions in shadow mode against production before cutting over.
- Require bi-directional CMMS integration so every prediction generates a real work order, and every completed repair feeds back into model validation, a loop covered in more detail in Digitalfractal’s guide to workflow automation.
- Segment OT network access from IT systems and document data sovereignty requirements for any cloud processing.
Assign clear owners before you scale:
- Data steward: owns schema consistency and data-quality monitoring.
- OT engineer: owns sensor calibration and edge hardware health.
- IT security: owns network segmentation and authentication.
- Reliability engineer: owns acceptance criteria and work-order feedback quality.
How Do You Evaluate a Sensor Fusion Partner or Vendor?
Most brownfield industrial sites have decades of mismatched sensors, legacy SCADA systems, and CMMS platforms nobody wants to replace. That reality favors a partner who can integrate around what already exists over a vendor selling a closed, sensor-locked product.
Run every candidate through the same checklist:
- Can they demonstrate OT connector experience with your specific control systems, not just generic IoT platforms?
- Do they have documented edge deployment experience for offline or low-connectivity sites?
- Will they integrate bi-directionally with your existing CMMS, or does their tool require replacing it?
- What are their SLA terms for model support and retraining after go-live?
- Can they show references from a comparable asset class, ideally with measured outcomes?
| Evaluation criterion | Pilot-first consultancy | Turnkey product vendor |
|---|---|---|
| Brownfield integration | Strong, built around existing systems | Often requires new hardware |
| Data readiness assessment | Included upfront | Frequently assumed complete |
| CMMS bi-directional flow | Custom-built to your stack | Limited to native integrations |
| Model transparency | Tailored to your risk tolerance | Fixed to vendor’s model type |
Turnkey product vendors optimize for their own platform, which is fine when your data is clean and your assets match their assumptions. Most industrial sites don’t fit that description, which is why a pilot-first consultancy that starts with an audit tends to produce a program that actually scales. Digitalfractal’s AI Readiness Audit is built specifically for this brownfield reality, starting with failure-mode mapping before recommending any specific model or sensor investment.
What ROI Can You Realistically Expect?
Results vary by asset class, data quality, and connectivity, but the documented ranges give you something concrete to plan against rather than vendor marketing language.
| Case | Metric | Result |
|---|---|---|
| Offshore rotating equipment, offline fusion framework | KPI improvement vs. conventional maintenance | 15 to 20 percent |
| Heavy construction fleet (150 excavators), 18 months | Unplanned downtime reduction | 34 percent |
| Same construction fleet case | Maintenance cost reduction | 28 percent |
| Same construction fleet case | Prediction accuracy | 89.3 percent |
The variance between these numbers comes down to three drivers: data quality going in, how consistent your operating conditions are, and how tightly the predictive output ties back into an actual work-order process. A model with 90 percent accuracy that never triggers a maintenance action delivers zero ROI. Treat every published figure as a range to validate against your own pilot, not a guarantee, and design your pilot’s acceptance criteria before you start collecting results.
What Does a Realistic Timeline and Budget Look Like?
Set expectations before your first sensor gets installed, because the biggest cause of stalled PdM programs is a mismatch between what the team expected and what an honest rollout actually takes.
- Audit phase (2 to 4 weeks): asset and failure-mode mapping, data readiness scoring, integration gap analysis. Deliverable: a pilot recommendation with defined success metrics.
- Pilot phase (6 to 12 weeks): sensor deployment if needed, fusion pipeline build, initial model or health index, validation against real events.
- Scale phase (ongoing, typically starting 3 to 6 months in): extend the validated architecture to additional assets or sites, reusing the same integration layer.
Cost scales with asset count, connectivity complexity, and how much of your existing sensor infrastructure is usable versus needing replacement.
| Phase | Typical scope | Where cost concentrates |
|---|---|---|
| Audit | Single facility or asset class | Time and access to legacy systems |
| Small pilot | One critical asset, 3 to 6 months | Sensor gap-fill, integration build |
| Enterprise scale | Multiple sites or asset classes | Edge hardware, ongoing model support |
Spend your early budget on data readiness and integration work before edge hardware. A perfectly instrumented asset feeding into a broken integration layer produces nothing usable, while cloud deployment cost-saving strategies can offset scaling costs once your pipeline is proven.
Why Pilot-First Beats Model-First, Every Time
The industry’s default sales pitch is backwards. Most vendors lead with the model, the accuracy percentage, the algorithm name. That’s the wrong end of the problem.
The teams that actually get value from fusion start with the boring part: which failure modes cost the most, which assets have usable data today, and whether the CMMS can even receive an automated work order. The 89.3 percent accuracy figure from the construction fleet study means nothing without the 34 percent downtime reduction that followed it, and that reduction only happened because the prediction pipeline was wired into an actual maintenance workflow.
I’d argue most PdM failures aren’t model failures at all. They’re integration failures dressed up as accuracy problems. A team spends six months tuning a model that was never going to matter because nobody built the path from prediction to work order. That’s the gap an audit is designed to catch before it costs you a year and a budget cycle.
The uncomfortable truth for a lot of technical leads is that the sensor data and the algorithm are usually the easy 20 percent. The integration, governance, and organizational buy-in are the hard 80 percent, and that’s exactly where a pilot-first, audit-driven approach earns its cost.
Get a Clear Picture of Your Data Before You Commit to a Platform
Most PdM vendors want to sell you a model first and figure out your data situation later, which is backwards and expensive when it fails. Digitalfractal starts the other direction: an AI Readiness Audit that maps your asset failure modes, scores your actual data readiness, and recommends one pilot asset before any platform decision gets made.
That sequencing matters because a pilot built on the wrong asset, or on data that can’t support fusion yet, wastes months you don’t get back. Digitalfractal’s consulting work spans AI readiness assessment, integration between OT sensors and your CMMS or ERP, and pilot execution designed to prove value within a defined window rather than dragging on indefinitely. If you’re weighing whether your current sensor mix and systems can support predictive maintenance, the AI Readiness Audit is the place to start, and Digitalfractal’s AI Integration Consulting service picks up from there to build the fusion pipeline and CMMS connections. Request a scoping call to find out which asset in your fleet or facility is the right first pilot.
Sources
- FUSION OF VIBRATION, ULTRASOUND, AND TEMPERATURE FOR OFFLINE SMART PREDICTIVE MAINTENANCE ON OIL AND GAS PLATFORMS ROTATING EQUIPMENT: A PRELIMINARY MATHEMATICAL FRAMEWORK
- Multi-Modal Sensor Fusion and Ensemble Learning Predictive Maintenance in Heavy Construction Equipment: A Stochastic Failure Prognostics Framework
- MDPI — Sensor-to-Scale lifecycle and data integration for PdM (2025)
- Towards intelligent industrial systems: A comprehensive survey of sensor fusion techniques in IIoT