
Construction Schedule Risk: How to Find, Size and Reduce It

Construction schedule risk is the chance that a project misses its planned finish date because something in the plan, the supply chain, the site or the weather behaves differently than assumed. You manage it in three moves: find the drivers, put numbers on them with a schedule risk analysis, and assign owners to mitigations that are actually new. This guide walks through each move, shows how to read the results, and explains where automation helps a Canadian contractor or owner see trouble earlier.
TL;DR
- Schedule risk is a probability, not a single date. A fixed finish date from a deterministic schedule often has a low chance of being met once uncertainty is modelled.
- The usual drivers are late materials and labour, permits and inspections, weather, site access, and late design clarifications. A weak baseline schedule makes all of them worse.
- Monte Carlo simulation on your existing schedule gives you confidence levels such as P-80, which turn into a time contingency you can defend.
- Mitigation only counts if it is new, owned and costed. Repeating current practice does not move the odds.
- Digital Fractal builds automation for construction and logistics teams and starts with an AI Readiness Audit to find where delay signals are being missed.
Table of Contents
- What construction schedule risk actually is
- The risk drivers to check first
- How schedule risk analysis puts numbers on delay
- Choosing a method
- Reading the results: what P-80 means for your finish date
- Reducing schedule risk without fooling yourself
- Where automation helps
- Our perspective
- Start with an AI Readiness Audit
- FAQ
- Sources
What construction schedule risk actually is
Schedule risk describes the likelihood that a project will not meet its planned timeline, because known and unknown risks can affect task execution, start and end dates, and durations. ProjectManager’s overview of schedule risk analysis frames it the same way, and it lists the usual suspects: labour and material shortages, supply disruptions, site congestion, slow permits and inspections, extreme weather and late design revisions.
Two things are worth separating early, because they behave differently in a model.
- Uncertainty is the natural spread in how long a task takes. A concrete pour might take three days or five, even with nothing going wrong.
- Risk events are things that may or may not happen, with a probability and an impact. A switchgear delivery slipping by months is an event, not a spread.
Mixing the two is one of the classic modelling mistakes, and we come back to it below.
Where delays really start
Most delays do not begin with a dramatic failure on site. ConsultLeopard’s risk management guide describes them as starting quietly inside a schedule that no longer tells the full truth: long-lead items slip, submittal reviews take longer than planned, and trades finish areas late. It also points to a weak baseline with loose logic as one of the most common sources of later conflict.
That matches what we see in practice. By the time a delay is visible on the Gantt chart, it has usually been visible in a document, an email or a delivery status for weeks.
The risk drivers to check first
Use this list as a starting register. For each driver, ask what early signal would tell you it is turning against you.
| Driver | Typical way it hits the schedule | Early warning signal |
|---|---|---|
| Materials and long-lead items | A late delivery holds every trade that follows | Supplier confirmation dates drifting, missing shipping updates |
| Labour availability | Crews arrive late or thin, so production falls behind | Rising overtime, trades asking to resequence |
| Permits and inspections | Approvals arrive after the work they gate | Open review comments, inspection requests waiting |
| Weather | Exterior and earthwork activities stop | Float on exterior activities shrinking before the season turns |
| Design clarity | RFIs and revisions stall the work in front of the crew | Growing RFI backlog, late submittals |
| Equipment and fuel | Breakdowns or missed refuelling idle crews | Maintenance logs, delivery gaps |
| Site access and congestion | Trades block each other | Overlapping area bookings |
Weather and supply are the two that most readers underestimate. Miter’s construction risk guide lists weather delays, labour and material shortages and equipment breakdowns as the common schedule risks, and notes that unplanned stoppages leave crews idle and push back delivery.
Fuel is a good example of a small input with a large schedule effect. If generators or heavy equipment run dry, the critical path stops regardless of how good the plan was. Planning deliveries and emergency resupply is covered in this six-step guide to fuel logistics for construction managers, and it is a sensible item to put on any risk register for remote or large sites.
Paperwork risk is schedule risk
Two of the most common slow leaks are document-driven. Requests for information that sit unanswered hold up the work they relate to, and submittals that bounce between reviewers delay procurement. If either is a recurring problem on your projects, our guides on RFI automation in construction, submittal tracking with AI and construction document control go into the workflow detail.
How schedule risk analysis puts numbers on delay
The Pacific Northwest National Laboratory describes schedule risk analysis as a defined, objective method to identify risks, quantify their impacts and prioritize mitigation so that the project is more likely to finish on schedule and on budget. It works from the project’s existing schedule and resources and propagates the impacts of risks through a Monte Carlo simulation.
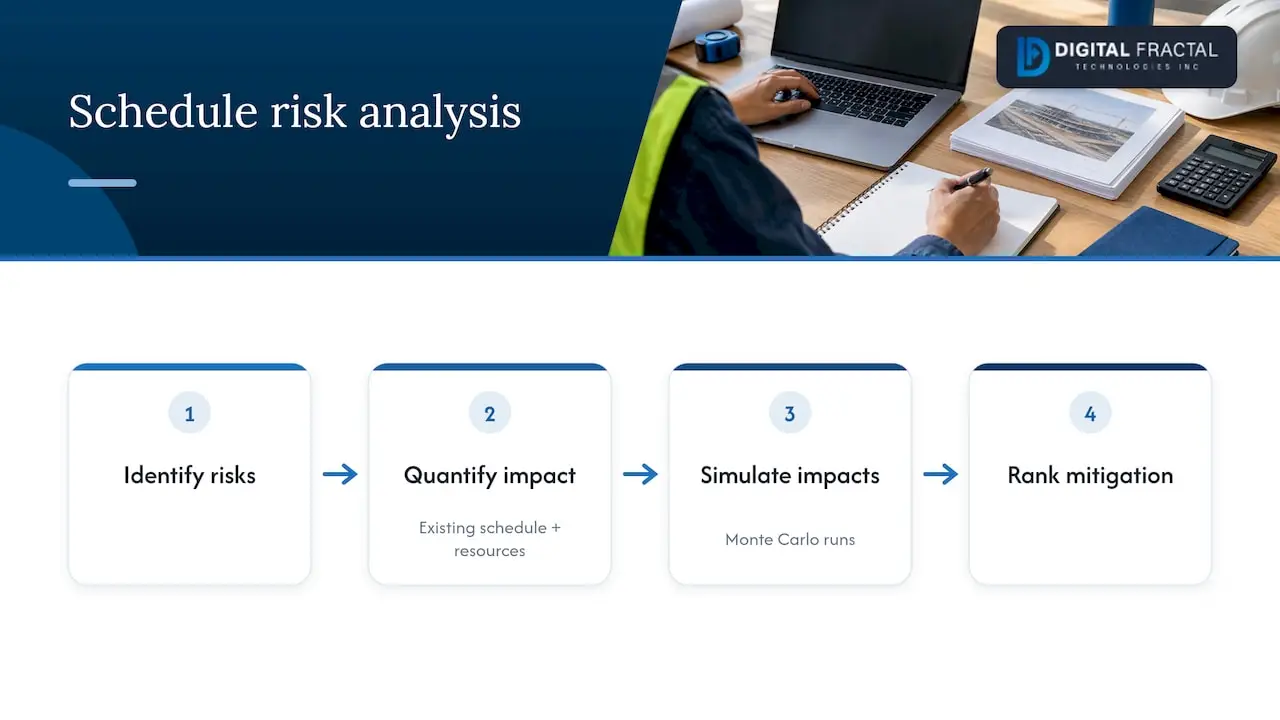
In plain terms, the analysis runs your schedule thousands of times. Each run draws a different duration for each uncertain task and switches risk events on or off according to their probabilities. The result is a distribution of possible finish dates rather than one date.
The steps
- Start from a sound schedule. A schedule with missing logic or unrealistic links gives misleading results. Fix the baseline first.
- Identify risk drivers with the right people. AACE International’s recommended practice on contingency estimating says any method for quantifying risk should start with risk drivers identified with input from all appropriate parties, and should clearly link those drivers to cost and schedule outcomes.
- Estimate duration uncertainty. Use low, most likely and high durations for tasks that carry real variation.
- Add risk events. Give each a probability, an impact range and the activities it touches.
- Run the simulation and read the confidence levels.
- Mitigate, re-run and compare.
Keep the model small enough to think about
Martin Hopkinson’s brief guide to schedule risk analysis recommends that most schedule risk models include roughly 10 to 200 activities, with the upper end reserved for very large, complex projects whose plans are mature and stable. That means the risk model is usually a summarized version of the detailed schedule, not a copy of it.
The same paper lists five common mistakes:
- copying the detailed schedule to build the model;
- using unrealistic, auto-generated duration ranges such as plus or minus 10%;
- failing to separate duration uncertainty from risk events;
- including ill-defined activities and risks;
- not stating the key overarching assumptions.
If your last schedule risk exercise produced a suspiciously tight range, check the second item first.
Choosing a method
No single method suits every project. AACE’s recommended practice on integrated cost and schedule risk analysis suggests considering both critical path method (CPM) based and expected value methods where possible: expected value across every project in a portfolio regardless of the quality of the base plan, and CPM-based methods for major or strategic projects where quality schedules are more typical. The same document separates systemic risks, which have predictable relationships to overall cost and schedule growth, from project-specific risks that do not.
A later AACE practice explains that it combines estimate ranging and expected value with Monte Carlo simulation because no single method is best for quantifying both inherent and project-specific risk when scope is well defined. The hybrid generates cost and duration distributions with a joint confidence level.
| Approach | What it reveals | Best fit |
|---|---|---|
| Monte Carlo on the CPM schedule | Probability of each finish date, which tasks drive the spread | Major projects with a quality schedule |
| Expected value | Risk-by-risk link between drivers and impact | Every project in a portfolio, including early-stage ones |
| Hybrid (ranging plus expected value plus Monte Carlo) | Joint cost and duration confidence | Well-defined scope, both systemic and project-specific risk |
A Monte Carlo simulation calculates possible project cost and schedule values from individual risks and turns them into project-level distributions from which statistical statements can be made.
Reading the results: what P-80 means for your finish date
A confidence level is the probability that the project finishes on or before a date. P-80 means an 80% chance of finishing by that date or earlier. The gap between your deterministic date and the P-80 date is your schedule contingency.
Two published examples show how large that gap can be.
- In a case study from an AACE paper, the deterministic date of 29 April 2013 was only about 4% likely to be achieved. At P-80 the project would finish on 26 November 2013 or earlier, which required about seven months of time contingency.
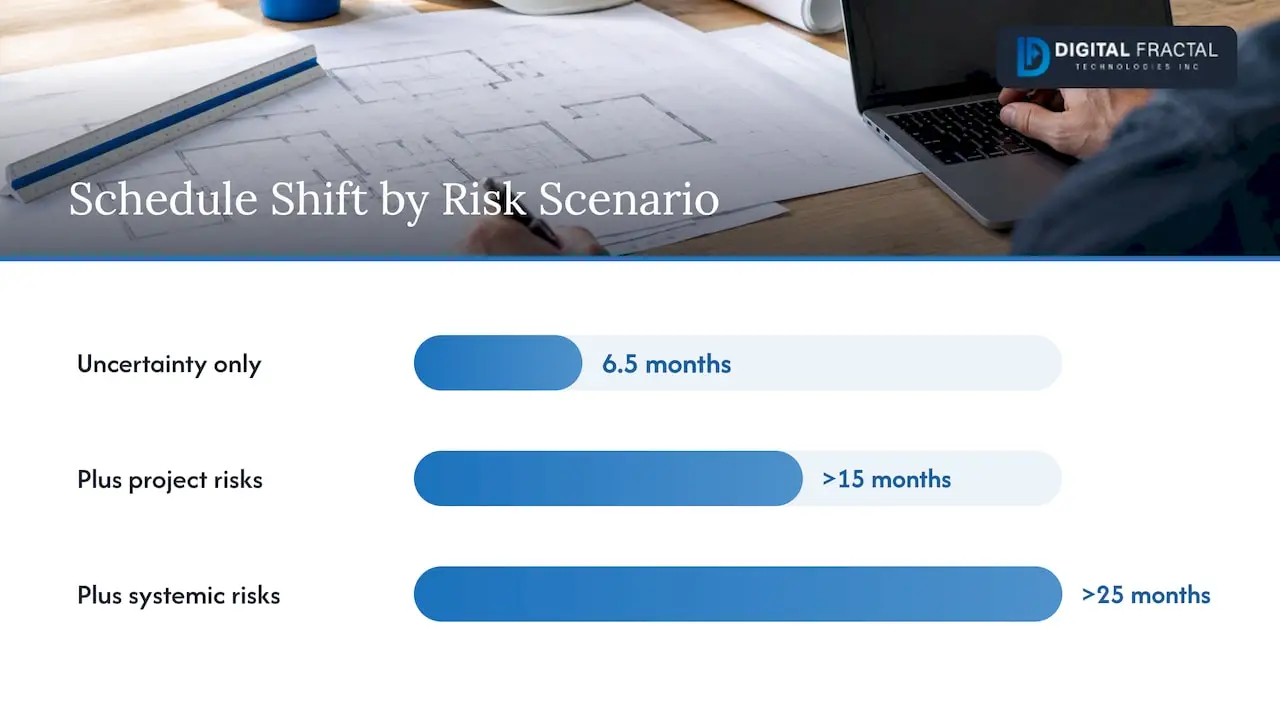
- In a modern analysis by Hulett & Associates, with uncertainty alone the P-80 was 6.5 months after the scheduled date and the odds of meeting it were 14%. Adding project-specific risks pushed P-80 more than 15 months past the schedule date, with the scheduled date only 2% likely. Adding three systemic risks (interdependency, coordination and excessive schedule pressure) moved it past 25 months. Total pre-mitigated contingency was 772 days, of which 574 came from risks and 198 from uncertainty.
The lesson is not that every project will slip by years. It is that a single date hides a wide range, and that risk events typically contribute more than ordinary task variation.
How to use the output
- Pick a confidence level on purpose. Owners, lenders and contractors often hold different appetites. State which one the commitment date uses.
- Read the drivers, not just the date. Sensitivity results show which tasks and risks move the finish most. Those get your attention first.
- Keep contingency visible. Hiding it inside task durations makes it impossible to manage and invites padding wars.
Reducing schedule risk without fooling yourself
Hulett describes a mitigation workshop in which the owner and the contractor separately propose mitigations for the same prioritized risks, including costs, action owners and improved risk parameters, then meet to agree. The key rule: mitigations must be new. Continuing what the team already does is already in the model.
A practical sequence:
- Rank risks by their effect on the finish date.
- For the top ten, write one new action each, with an owner, a cost and a date.
- Re-enter the improved probabilities and impacts and re-run.
- Keep only the actions that move the P-80 enough to justify their cost.
- Track the leading indicators from the earlier table weekly.
The step most teams skip is the last one. A risk register that is reviewed once at kickoff is a document, not a control.
The Canadian context
For major Canadian projects, permitting timelines, consultation requirements, labour and supply-chain constraints and enabling infrastructure are recurring systemic risks. Guidehouse’s June 2026 analysis of how Canada can break the major project failure loop recommends a portfolio-level register for these cross-cutting risks with clear ownership, and independent early-stage challenge that includes reference-class forecasting and probability-based schedule ranges. Even on a smaller project, the habit transfers: state the range, not only the date.
Where automation helps
A schedule risk analysis is a snapshot. Risks change weekly, and the signals sit in many systems: supplier emails, RFI logs, submittal registers, timesheets, equipment telemetry and inspection bookings. Automation earns its place by pulling those signals together and flagging drift before it reaches the critical path.
Examples of what a tailored setup can do:
- watch RFI and submittal ageing and alert the person who owns the blocker;
- reconcile delivery confirmations against the dates the schedule assumes;
- balance crews against upcoming work, as in our AI-powered workforce scheduling case study;
- feed a progress view that matches the field, as in our construction progress management project.
If you want a rough sense of duration before you build a risk model, our project timeline calculator is a quick starting point, and our guide to the best construction project management software for Canadian builders covers the tool side.
Our perspective
Most schedule risk work we see stops at the model. A consultant builds a simulation, hands over a report with a P-80 date, and the project team goes back to the same email threads and spreadsheets. The numbers were right on the day and stale a month later.
We think the useful question is not “what is our risk?” but “which delay signals are we currently missing, and which of them can a system catch for us?” That is why we begin with an AI Readiness Audit. It looks at your workflows, your data and your systems, and identifies where automation can surface RFI backlogs, late submittals, supplier drift and crew shortfalls before they hit the critical path.
We do not sell generic consulting. Our solutions are tailored to your workflows, systems and goals, and we aim to deliver tangible change within 90 days. For a construction or logistics team, that means mitigation actions that run every day, not a register that is reviewed twice a year.
Souhail
Start with an AI Readiness Audit
If delay signals on your projects live in inboxes, spreadsheets and people’s heads, the first step is to find out what can be automated and what data is ready to support it. Our AI Readiness Audit is a one-off engagement priced at $2,500 to $10,000, and it maps the opportunities for construction, logistics and similar operations. From there we can build the workflow automation that follows.
If you already know the process you want to tighten, see our workflow automation service, or book a conversation through our site about your project.
FAQ
What is the difference between schedule risk analysis and a normal schedule review?
A schedule review checks logic, durations and sequencing in a single deterministic plan. A schedule risk analysis adds uncertainty and risk events, then simulates the schedule many times to produce a probability for each possible finish date. The review makes the plan sound; the analysis tells you how likely the plan is to hold.
How many activities should a schedule risk model include?
Hopkinson recommends roughly 10 to 200 activities for most models, with the higher end only for very large, complex projects with mature and stable plans. The model should be a summarized version of the detailed schedule, with realistic duration ranges and clearly defined risks.
What does P-80 mean in a construction schedule?
P-80 is the date by which there is an 80% chance the project finishes, according to the simulation. The difference between your deterministic date and the P-80 date is a defensible time contingency. Teams choose the confidence level that matches their risk appetite and state it in the contract or the project plan.
Can AI reduce construction schedule risk?
It can reduce the time between a signal appearing and someone acting on it, for example an RFI that has gone unanswered or a delivery that has not been confirmed. We build tailored automation for this kind of work, and an AI Readiness Audit is where we identify which workflows and data are ready for it.
Sources
- Schedule Risk Analysis, PNNL
- AACE International 40R-08: Contingency Estimating, General Principles
- AACE International 65R-11: Integrated Cost and Schedule Risk Analysis
- AACE International 123R-22: Integrated Cost and Schedule Risk Analysis and Contingency Determination
- Integrated Cost and Schedule Risk Analysis (Palisade/Lumivero)
- Schedule Risk Analysis: A brief guide, Martin Hopkinson, PM World Journal
- Modern Methods of Schedule Risk Analysis using Monte Carlo Simulation, Hulett & Associates
- Schedule Risk Analysis in Construction, ProjectManager
- Construction Schedule Risk Management, ConsultLeopard
- Construction risk management, Miter
- How Canada can break the major project failure loop, Guidehouse