
Demand Sensing AI: How It Works and Where to Start in Canada

Demand sensing AI is a short-term forecasting layer. It uses machine learning and fresh, high-frequency data (orders, point-of-sale, inventory, weather, promotions) to correct the next few days or weeks of your demand plan, then passes that correction to replenishment. It does not replace your monthly plan. It keeps the near-term part of that plan from going stale.
If you run logistics, distribution or inventory-heavy operations in Canada, this guide covers how it works, what it needs from your data, what research says it can deliver, and how to prepare before you build or buy anything.
TL;DR
- Demand sensing refines the short-term slice of a baseline forecast, usually days to a few weeks out, using signals that update daily or even hourly.
- It feeds replenishment: when the sensed forecast moves, reorder quantities, allocations and transfers move with it.
- Peer-reviewed studies report lower forecast error, less safety stock and fewer stockouts in tested settings. Your results depend on your data.
- The biggest blockers are data quality and process, not algorithms. Fix signal definitions, timing and exception rules first.
- A readiness audit before any build shows which signals you already have and where a 90-day pilot makes sense.
Table of Contents
- What demand sensing AI actually is
- What real-time data demand sensing uses
- From sensing to replenishment analytics
- What the evidence says about results
- Where demand sensing pays off in operations
- What to get right before you implement
- A practical path from first signal to live replenishment
- How Digital Fractal can help
- FAQ
- Sources
What demand sensing AI actually is
Traditional demand planning builds a forecast from historical, aggregated sales and refreshes it weekly, monthly or quarterly. That works for strategic decisions such as capacity, sourcing and budgets. It struggles with next Tuesday: a cold snap, a competitor’s flash sale, a delayed shipment or a large customer pulling orders forward.
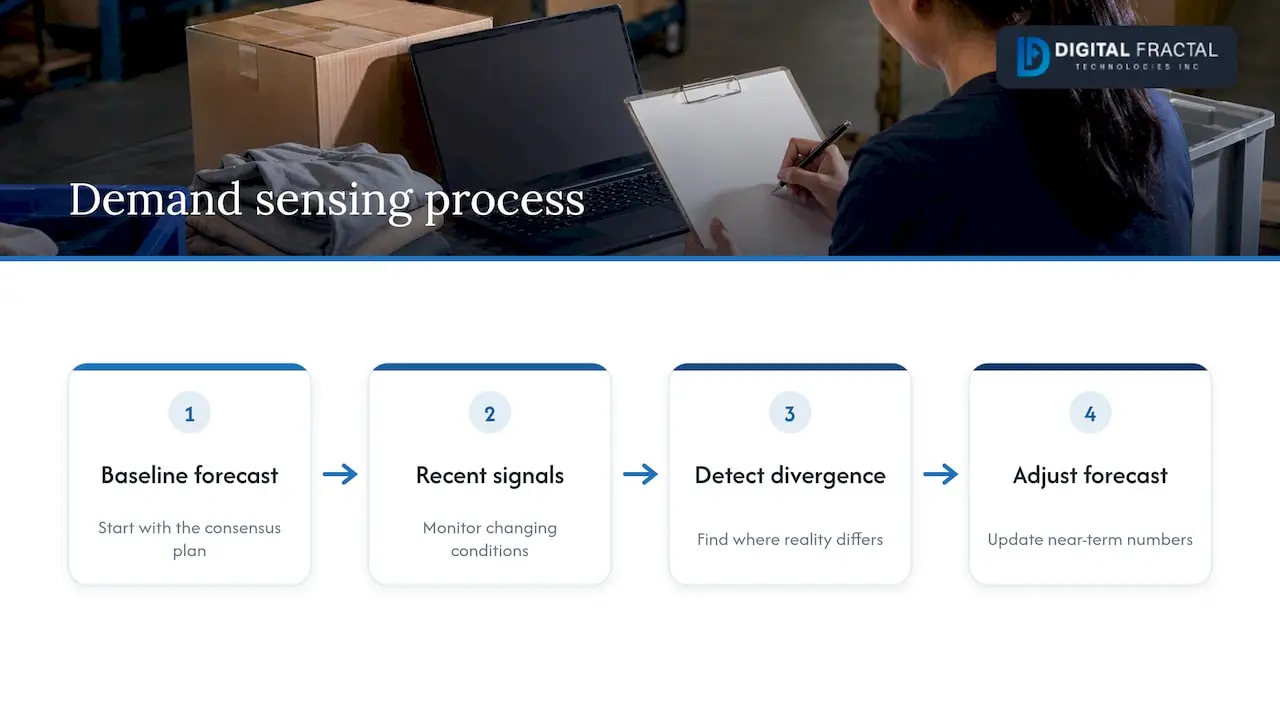
Demand sensing sits on top of that plan. It takes the consensus baseline, watches recent signals, detects where reality is diverging from the forecast, and adjusts the near-term numbers, often down to the SKU and the region or location. Vendors and practitioners describe the typical horizon as days to a few weeks, and sometimes up to about two months. The longer-range plan stays largely intact.
The “AI” part matters because the signals are many, noisy and arrive at different speeds. Machine learning models test several approaches automatically, pick up patterns a fixed statistical formula misses, and keep updating as conditions change, without a full forecast rebuild.
Demand sensing vs. traditional demand planning
| Dimension | Traditional demand planning | Demand sensing AI |
|---|---|---|
| Main data | Historical, aggregated sales | High-frequency signals plus history |
| Update frequency | Weekly, monthly or quarterly | Daily or intraday |
| Horizon | Months to years | Days to several weeks |
| Granularity | Product family, region | SKU, location, channel |
| Method | Statistical models, planner judgment | Machine learning, pattern recognition |
| Adaptability to sudden events | Low | High |
| Main output used for | Capacity, budgets, sourcing | Replenishment, allocation, transfers |
The two are not rivals. Think of demand planning as the process and demand sensing as a capability inside it.
What real-time data demand sensing uses
A sensing model is only as good as the signals feeding it. Most implementations combine internal and external sources.
Internal signals
- Point-of-sale or sell-out data, where you have it
- Incoming purchase and sales orders, often the last 24 to 72 hours
- Inventory levels across warehouses, stores and in-transit stock
- E-commerce behavior such as carts, searches and conversion
- Active promotions and price changes
- Shipment and delivery status
External signals
- Weather and weather forecasts
- Local events and holidays
- Competitor promotions and price moves
- Economic indicators, news and sometimes social media sentiment
The workflow is generally the same. A baseline forecast is created. Signals are collected, aligned and cleaned, often inside connected ERP and supply planning systems. The model flags divergence from the baseline using pattern recognition. The near-term forecast is updated, and replenishment quantities follow.
For a Canadian operation, a few signals deserve extra thought. Weather swings are large and regional, so a single national weather feed is rarely enough. Distances between nodes are long, so lead times and in-transit inventory shape how far ahead a sensed signal can be acted on. Seasonality, including winter road conditions and provincial holidays, varies by region. Treat region-level granularity as a requirement, not a nice-to-have.
From sensing to replenishment analytics
A sharper forecast changes nothing until it changes an order. That is where replenishment analytics and replenishment optimization come in.
The logic runs like this:
- Demand sensing updates the near-term forecast using recent signals.
- Projected inventory is recalculated against the new demand curve, so you see where stock will run out earlier or sit longer than planned.
- Replenishment plans realign: reorder points, order quantities, safety stock targets, transfers between locations and allocation across channels.
- Constraints are applied: supplier lead times, minimum order quantities, truck capacity, warehouse space and service-level targets.
- The system recommends actions, or executes them within rules you set, and shows the cost and service trade-off.
Sensed forecasts can also guide transportation plans, production and packaging sequences, and purchasing. A short-term forecast four to eight weeks out is enough to adjust inventory deployment and transport capacity before the shift hits.
The practical point: the model is only one component. The rules that turn a forecast into a purchase order (safety stock policy, supplier terms, approval thresholds) decide whether the improved accuracy reaches your balance sheet. If you are tuning those rules, our guide to AI inventory optimization covers that side in depth, and how AI improves custom inventory systems shows what changes when the inventory system itself is built around those signals.
What the evidence says about results
Vendor pages are full of big claims, so it helps to look at independent research.
A 2025 study in the Journal of Marketing & Social Research tested AI-based demand sensing against baseline methods. An LSTM model cut forecast error (MAPE) by 27.4 percent, and a hybrid deep learning model cut it by 32.8 percent. Safety stock fell 18.6 percent, holding costs fell 14.2 percent, and order variance amplification (the bullwhip effect) fell 22.9 percent.
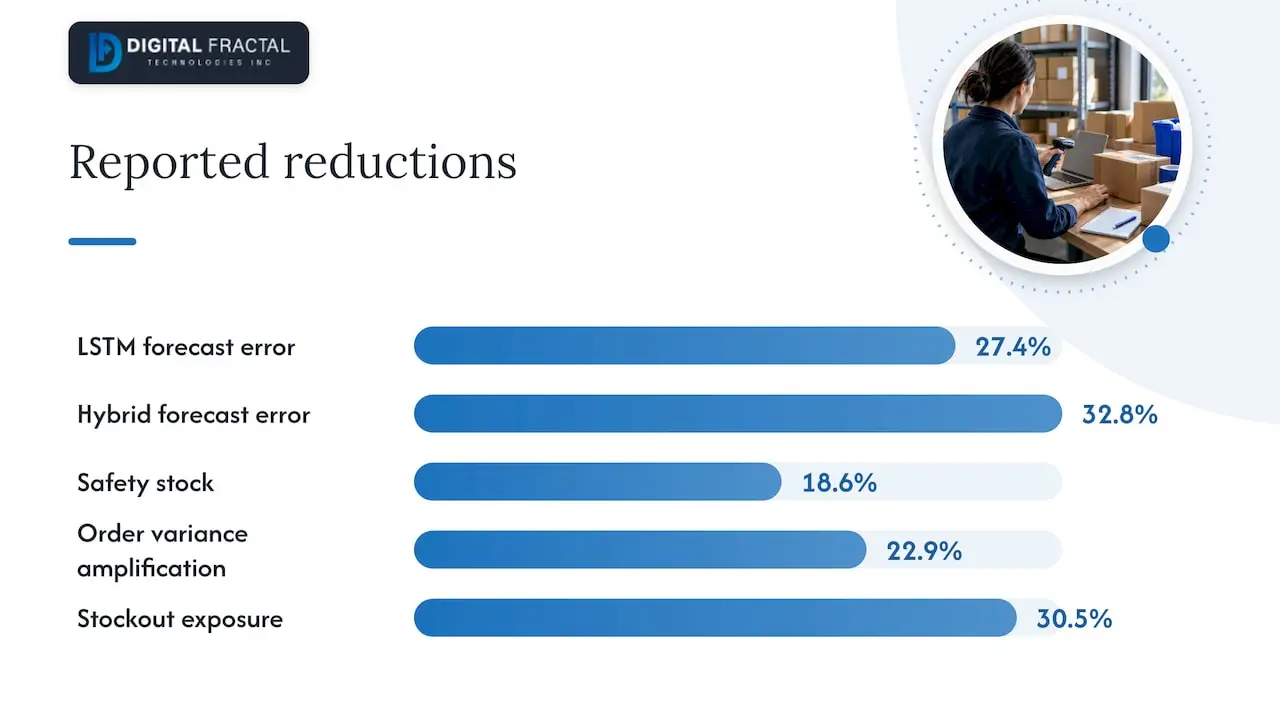
A separate study on demand sensing for independent grocers looked at a lightweight model for small retailers. In a replenishment simulation, demand sensing reduced estimated stockout exposure by 30.5 percent compared with a simple lag-7 heuristic (using last week’s sales as the forecast).
Two takeaways. First, the gains show up in three places at once: forecast accuracy, inventory carried and stockouts. Second, the grocer study shows you do not need an enterprise-scale data lake to start. A model built on a modest set of well-chosen signals can beat a naive rule.
These are results from specific datasets and test setups. Your gain will depend on demand volatility, data quality, lead times and how quickly you can act on a signal.
Where demand sensing pays off in operations
Demand sensing helps most where demand moves faster than your planning cycle and where you can act within days.
- Distribution and logistics: adjust inbound and outbound capacity, rebalance stock between warehouses, and reduce expedited freight.
- Retail and e-commerce: react to promotions, weather and local events at the store or fulfillment-center level.
- Parts and field service: keep the right parts on trucks and in branches. A practical look at the replenishment side of this is in this piece on reorder points that keep technicians working.
- Construction and industrial supply: anticipate material draws tied to project schedules and weather.
It helps least where demand is already stable, lead times are longer than the sensing horizon, or you cannot change orders quickly. In those cases, better baseline forecasting or lead time work comes first. Knowing which situation you are in is the purpose of a proper assessment.
What to get right before you implement
Most failed pilots fail on the basics. Check these before choosing a model.
Data alignment
Signals arrive at different speeds and use different definitions. One system counts an order when it is placed, another when it ships. One calls a SKU by supplier code, another by internal code. Models trained on mismatched inputs produce confident nonsense. Agree on definitions, time stamps and units first. Our guide to enterprise data readiness walks through how to assess this.
Guardrails against overreaction
A model that chases every spike creates volatility of its own. Set thresholds for how much a sensed forecast may move the plan in a day, define exception rules for promotions and one-off events, and require human approval above a set order value.
Explainability and audit trails
Planners will not trust a number they cannot interrogate. Choose approaches that show which signals drove an adjustment, and keep a log of every change and who approved it. This builds trust faster than any accuracy chart.
Integration with your existing systems
The output has to land where decisions are made: your ERP, warehouse management system or purchasing workflow. A sensing model that lives in a separate dashboard gets ignored. This is why integration and workflow automation matter as much as the model. Our workflow automation work covers connecting recommendations to the systems that act on them.
Ownership
Name one owner for the signal definitions and one for the replenishment rules. Without owners, drift sets in within months.
A practical path from first signal to live replenishment
- Pick one decision. For example, weekly replenishment for the top 200 SKUs in two regions.
- Inventory your signals. List what you have, how often it updates, and how clean it is. Rank by expected value.
- Set a baseline. Measure today’s forecast error and stockout rate for that decision. Without a baseline you cannot show improvement.
- Build a lightweight sensing layer. Start with three to five signals, not thirty.
- Run in shadow mode. Compare sensed recommendations against what planners actually ordered, without changing anything.
- Go live with guardrails. Limit auto-adjustments to a band, route exceptions to a planner, log everything.
- Expand. Add signals, SKUs and regions once the first decision shows measurable gains.
Our AI implementation planner can help you structure these steps against your own constraints.
Our perspective
Most companies that ask us about demand sensing do not have a modeling problem. They have a connection problem. The orders sit in one system, inventory in another, and the person who adjusts replenishment works from a spreadsheet exported on Monday.
That is why we do not start with an algorithm. We start with the decision you want to improve, then trace the data and the workflow around it. Our approach is tailored to your systems and goals rather than an off-the-shelf package, because a sensing model that does not fit your lead times, your ERP and your planners’ habits will not get used.
We aim for visible results inside 90 days: one decision, a few well-chosen signals, a working loop from forecast to replenishment action. Once that loop works, scaling is an engineering exercise instead of a leap of faith.
Souhail
How Digital Fractal can help
We work with logistics firms, construction companies and other operators who want AI that fits their workflows. For demand sensing, the sensible first step is our AI Readiness Audit, a one-off engagement priced from $2,500 to $10,000. It identifies which signals you already have, where your data and processes need work, and which automation opportunities to tackle first. If you want to budget before you talk to anyone, our AI readiness assessment cost guide explains what drives the range.
After the audit, we build and integrate the solution: forecasting and replenishment logic, AI-powered scheduling for logistics teams, and the connections into your existing systems. See our AI consulting and machine learning solutions or get in touch through our site to talk through your use case.
FAQ
What is the difference between demand sensing and demand forecasting?
Demand forecasting builds the longer-range plan, usually from historical aggregated data refreshed weekly or monthly. Demand sensing adjusts the near-term portion of that plan using recent, high-frequency signals such as orders, point-of-sale and weather. Most organizations use both: forecasting for strategy and capacity, sensing for day-to-day replenishment.
How far ahead does short-term demand sensing forecast?
Typically days to a few weeks, and some approaches extend to about two months. Common practice is one to eight weeks, depending on the tool and the data. The useful horizon for you is bounded by your supplier and transport lead times: a signal is only valuable if you can still act on it.
Do I need a large data science team to start?
No. Research on independent grocers shows a lightweight model using a small set of signals can cut estimated stockout exposure against a simple heuristic. What you do need is clean, consistently defined data and someone who owns the replenishment rules. A readiness audit is the quickest way to find out where you stand.
How does demand sensing improve replenishment?
When the sensed forecast changes, projected inventory is recalculated, and replenishment quantities, safety stock targets and transfers adjust to match current demand rather than last month’s plan. Constraints such as lead times and truck capacity are applied so recommendations are executable. The result is fewer stockouts and less excess stock in the studies cited above.
Which industries benefit most?
Those with volatile demand and short decision windows: distribution and logistics, retail and e-commerce, field service parts and industrial supply. Operations with stable demand or very long lead times gain less from sensing and usually start with baseline forecasting improvements.
Sources
- The Impact of AI-Based Demand Sensing on Inventory (Journal of Marketing & Social Research, 2025)
- Demand-Sensing RTM for Independent Grocers: A Lightweight Model