
AI-Driven Kubernetes Scaling: Best Practices

If I want AI-driven Kubernetes scaling to work, I need to get four things right first: clean metrics, sane autoscaler setup, hard guardrails, and change control. The article’s core point is simple: AI should guide scaling, not run wild. Done well, forecast-assisted scaling can cut tail latency and lower SLA misses, but only when I have at least 30 days of metric history, clear fallback rules, and firm replica and budget limits in CAD.
Here’s the short version:
- Start with data quality
- Track pod, service, and cluster metrics
- Keep raw data for 14 days and downsampled data for 30–90 days
- Standardize labels like
team,environment,application,namespace, andregion - Store time in UTC and watch clock skew
- Set up autoscalers properly
- Use HPA for replicas
- Use VPA in recommendation mode first
- Use Cluster Autoscaler only when requests are accurate
- Use KEDA for queue-based and scale-to-zero workloads
- Add prediction with limits
- Feed HPA or KEDA with forecast metrics, not blind model output
- Backtest on 30–90 days of history
- Track MAE, RMSE, and MAPE
- Fall back to live metrics if forecast error gets too high or data is stale
- Control cost and risk
- Set min/max replicas
- Tie scaling to SLOs, node capacity, downstream limits, and daily budgets in $1,234.56 CAD format
- Review rightsizing, idle workloads, quotas, and rollback rules
- Keep records for approvals, residency, and privacy needs in Canada
What I like about this piece is that it doesn’t treat AI scaling like magic. It treats it like platform work: test it, limit it, price it, and review it. That’s the right frame if I care about latency, uptime, and cloud spend at the same time.
Kubernetes Autoscaling and FinOps Best Practices, with Amin Astaneh | KubeFM
sbb-itb-fd1fcab
Checklist 1: Confirm Observability and Data Quality Before Automation
Noisy, incomplete, or mislabelled metrics don’t just hurt accuracy. They can trigger thrashing, underprovisioning, and extra replica growth that pushes up cloud spend in CAD.
Collect Usable Metrics at Pod, Service, and Cluster Levels
You need clean instrumentation across the whole stack before automation is worth trusting.
At the pod level, collect CPU and memory usage against requests and limits, container restart counts, GPU use for AI/ML workloads, and per-container latency for critical requests. In many AI/ML setups, GPU saturation is the actual bottleneck, not CPU.
At the service level, track request rate (RPS/QPS), p95 and p99 latency, error rate, and queue depth for message brokers or stream processors.
At the cluster level, monitor node use, scheduling and eviction events, and pending pods caused by low memory or GPU capacity.
A solid starting point is:
- average pod CPU and memory use
- p95 service latency
- average RPS per pod
Keep at least 30 days of metrics before turning on AI-driven scaling. Store raw high-resolution data for 14 days, then keep downsampled 1–5 minute data for 30–90 days.
Time sync matters more than many teams think. Sync all nodes and observability backends to accurate NTP sources, store timestamps in UTC, and check clock skew on a regular basis. Standardize labels on every pod and service. At a minimum, use team, environment, application, namespace, and region, then enforce them through admission controllers or GitOps policies.
Once those signals are steady, tie them to spend and rightsizing.
Track Utilisation and Cost by Namespace and Workload
When your metrics are clean, connect them to actual spend. Tools like Kubecost and OpenCost roll up pod costs by namespace and label. That means per-namespace cost is the total of pod costs in that namespace, and per-team cost can be filtered with the team label. That’s what makes chargeback and showback accurate.
Namespaces averaging under 10% CPU and under 20% memory are good rightsizing candidates. Cloud workload rightsizing guidance marks a workload as underprovisioned when CPU or memory use goes above 150% for at least 10% of the time over the last 15 days, then uses actual usage to suggest corrected request values.
Match the signal to the workload type. CPU and memory use fit compute-bound workloads. Request rate and latency fit synchronous APIs. Queue depth and lag fit event-driven systems. Business metrics, such as CAD transaction volume, help with seasonal demand modelling.
For synchronous APIs, make request rate and latency your main signals, and use CPU as a guardrail. For batch and stream processing, queue depth and processing lag should drive scaling, with node use as supporting context.
Before you push any new metric source into production scaling, run it in observe-only mode on past data and compare its recommendations with actual SLO outcomes.
Use those cost signals to decide which workloads can be scaled down safely or rebalanced.
Checklist 2: Configure Core Kubernetes Autoscalers Correctly
Once your metrics are clean, set up HPA, VPA, Cluster Autoscaler, and KEDA before you bring in predictive AI controls. If thresholds are off or node pools don’t match the workloads running on them, scaling gets shaky fast. And that usually means two things: waste and instability.
Set Up HPA and VPA with Accurate Requests, Probes, and Safe Limits
Start with accurate requests and limits before touching HPA or VPA. If requests are too low, you can run into throttling and messy utilisation signals. If they’re too high, costs go up and scheduling gets harder. The best move is to profile workloads under realistic traffic before you set those values.
Use the autoscaling/v2 API and define explicit minReplicas, maxReplicas, and behavior blocks. The behavior block lets you tune scale-up and scale-down on their own, which helps cut down replica flapping during bursty traffic.
For VPA, begin in Off mode so it can gather recommendations without changing live pods. Let those recommendations build over several weeks. Then review them and apply corrected request values by hand in your deployment manifests. After that baseline settles down, you can look at automatic modes during low-traffic periods to lower the chance of disruptive restarts.
Don’t run HPA and VPA on the same workload if they’re both acting on the same resource signal. A safer setup is simple: let VPA manage CPU and memory requests, while HPA scales replica count from a custom or external metric like requests per second or queue depth.
Set readiness and liveness probes to match actual service health. If timeouts are too aggressive, you can trigger restart loops and skew autoscaling behaviour. Before moving any HPA setup into production, test both scale-up and scale-down under load.
Once replica rules and request values are steady, the next step is to line up node pools with the workloads they need to support.
Align Cluster Autoscaler and Node Pools with Workload Types
Cluster Autoscaler adds nodes for pending pods and removes idle ones, but it only works well when pod resource requests are accurate. If those requests are off, it may add nodes that sit underused.
Split node pools by workload class. Put critical services in one pool and bursty or batch jobs in another. Also cap node pools by workload class so one group doesn’t grow out of control.
Use:
- taints and tolerations
- affinity and anti-affinity
- replica spreading across failure zones
These controls help keep workloads on the right pools and spread replicas where they should go.
Check namespace-level ResourceQuota settings before turning on Cluster Autoscaler in production. Quotas put limits on total CPU, memory, and persistent volume usage for each team or app. That helps stop one workload from eating up all cluster capacity or blowing past budget targets.
After node capacity is lined up, KEDA becomes the better fit for workloads that need to scale on events instead of utilisation.
Use KEDA for Event-Driven and Scale-to-Zero Scenarios
Use KEDA for triggers like queue depth, Kafka lag, or event rate instead of CPU. It supports scale-from-zero and scale-to-zero, which makes it a good match for intermittent workloads like background job processors, message queue consumers, or seasonal ingestion pipelines.
Set up your ScaledObject with clear values for minReplicaCount, maxReplicaCount, polling interval, and cooldown period. Only set minReplicaCount to 0 for workloads that can handle cold-start latency. User-facing services should keep a non-zero minimum so users don’t get hit with cold-start delay.
Don’t attach a separate HPA to a KEDA ScaledObject. KEDA manages its own HPA. If you need more than one scaler on the same workload, make sure they work together and that one scaler is clearly in charge.
With these core autoscaling pieces in place, predictive controls can step in earlier and apply tighter guardrails.
Checklist 3: Add Predictive AI Controls with Guardrails
Once your native autoscalers are set up and behaving well, you can add AI-based forecasting and anomaly detection on top. The point isn’t to hand scaling over to a model. It’s to give autoscalers better signals, so they can react earlier and with less guesswork. The autoscaler still makes the final replica call. AI just helps shape the inputs.
Use Forecasting and Anomaly Detection to Scale Ahead of Demand
Use forecasts as inputs, then put firm limits on how much they can affect replica counts.
Publish custom metrics like forecasted request rates, predicted CPU demand, and risk scores for HPA and KEDA to consume.
Train models on CPU, memory, request rate, and queue length data across daily, weekly, and seasonal patterns. Then layer in live telemetry. For Canadian operations, tag that data with local calendar signals such as statutory holidays, tax season, Boxing Day, RRSP deadlines, and provincial holidays. Use ISO dates (YYYY-MM-DD) and handle daylight saving time properly.
In one predictive Kubernetes autoscaling experiment, a hybrid time-series approach using multiple ML models reduced average response time by 14–20% and cut the proportion of requests taking longer than one second by 93–95% compared with default HPA.
Backtest against the last 30 to 90 days and track MAE, RMSE, and MAPE at 5-, 15-, and 60-minute horizons. If MAPE goes above 20% over 24 hours, or if forecast data is more than 5 minutes old, fall back to live utilisation metrics.
Anomaly detection should run beside forecasting, not replace it. Use it to spot deviations across more than one signal, such as request rate, latency, and CPU, before taking action. A spike in just one metric is often just noise. When you confirm a real anomaly, limit how fast replicas can grow – for example, no more than +50% per 5 minutes. That helps prevent runaway scaling from noisy inputs or a DDoS event.
Apply Feedback Loops, Replica Caps, and Budget Limits
Forecasts only matter if you compare them with actual results and keep them inside hard limits.
Models drift over time if you stop checking their accuracy and retraining them. Track predictions against actuals for each key metric, and expose error rates as metrics so alerts can fire when things slip. Retrain weekly or every two weeks, and also after major launches or seasonal peaks.
Replica guardrails are a must. For each workload, set clear minimum and maximum replica counts based on performance testing and cost limits. Public-facing services should keep at least 2–3 replicas across availability zones during off-peak hours. Maximum replica counts should reflect node capacity, downstream system limits like database connections and API rate quotas, and a daily budget cap in CAD. AI controllers must stay inside those boundaries. They can suggest replica counts within the allowed range, and Kubernetes enforces the limit.
Build cost awareness in from day one. Tag workloads and namespaces for cost allocation, set daily and monthly budgets by team or product line, and dial back pre-emptive scaling when projected spend gets close to the limit. Format dashboards in Canadian style, such as $1,234.56 CAD.
Treat SLOs as the last line of defence. If P95 latency starts nearing its threshold, scale up before CPU hits saturation. Block any scale-down that would push latency or error rates past safe limits, especially during filing deadlines or retail rushes.
Checklist 4: Protect Reliability, Control Cost, and Govern Changes
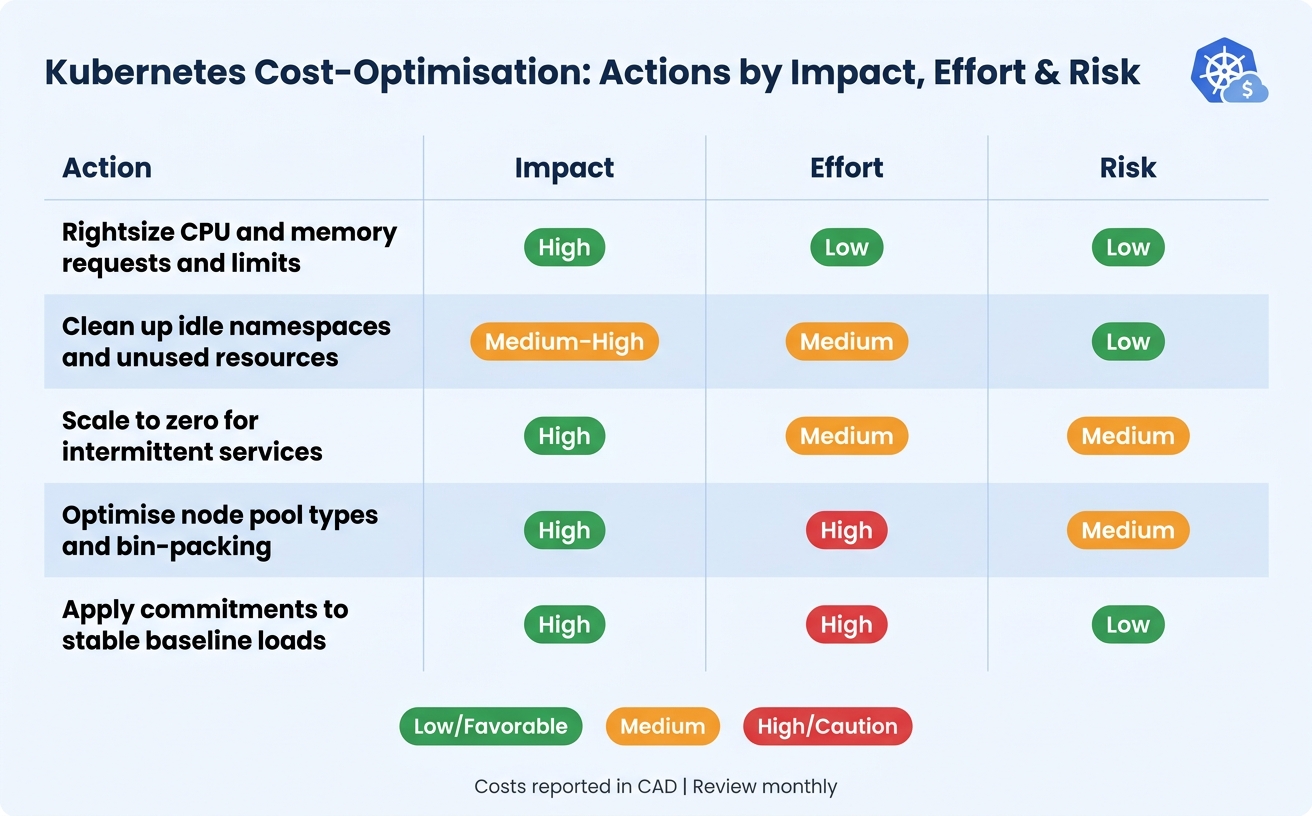
AI-Driven Kubernetes Scaling: Cost-Optimisation Actions by Impact, Effort & Risk
Once predictive scaling is live, don’t just leave it alone. Push it under load, put cost guardrails in place, and treat every scaling change like a production change.
Validate Performance and Failure Handling Under Real Load
Measure the full recovery path from a traffic spike to a stable state. That means scale-up latency, node provisioning, image pulls, pod start-up, and workload warm-up under both peak demand and spike conditions. Then compare those results against your SLOs.
Use priorities, node pools, safe-to-evict settings, and PDBs to protect customer-facing services. Check your probes too. A probe that’s too aggressive can cause avoidable restarts and make a bad moment worse.
Run node-drain and fault-injection tests to make sure the platform degrades in a controlled way. One common trap: PDBs that are too strict. They can stop the Cluster Autoscaler from terminating nodes, which can quietly push up your cloud bill without making the system more dependable. Percentage-based PDBs usually work better here. Review them whenever replica counts change, and use looser budgets for low-priority workloads.
Use what you learn from these tests to set replica caps, PDBs, and rollback thresholds.
Review Cost Controls, Rightsizing, and Idle Resource Cleanup
Track cost metrics by namespace and workload, report them by team or business unit in CAD, and review them every month.
Run VPA in recommendation mode so you can spot rightsizing opportunities without clashing with HPA replica decisions. Apply those suggestions manually. After that, enforce LimitRanges per namespace so workloads don’t drift back to poor settings. If a workload stays below 5% utilisation for seven or more days, flag it for action. In plain terms, either combine it with something else, remove it, or set it to scale to zero if cold starts won’t hurt the user experience.
Use ResourceQuota per namespace as a hard cap on total CPU and memory requests and limits. That way, one workload can’t take more cluster capacity than the platform team approved, even when forecasts point to higher demand.
| Cost-Optimisation Action | Impact | Effort | Risk |
|---|---|---|---|
| Rightsize CPU and memory requests and limits | High | Low | Low |
| Clean up idle namespaces and unused resources | Medium–High | Medium | Low |
| Scale to zero for intermittent services | High | Medium | Medium |
| Optimise node pool types and bin-packing | High | High | Medium |
| Apply commitments to stable baseline loads | High | High | Low |
Use the same monthly review to spot workloads that need tighter quotas or should be removed.
Set Governance Rules for Security, Compliance, and Rollout
Define SLOs and SLAs for each service, then tie PDBs and autoscaling policies straight to those targets.
Require change approvals for any update to scaling thresholds, predictive models, or rollback policies, especially in production clusters. Record both approvals and scaling actions in GitOps or a change log. For rollouts, use staged deployment and canary validation. Also, write down rollback criteria before the change goes live. It sounds basic, but this is the kind of prep that saves time when things go sideways.
For Canadian workloads, identify any personal, financial, health, or public-sector data that must stay in Canadian regions under PIPEDA or provincial privacy law. Observability data matters here too. Metrics, logs, traces, and model inputs can contain sensitive customer or operating data, so document where that data lives and who has access to it.
Create separate incident playbooks for overscaling and under-scaling because the response is not the same.
- Overscaling playbooks should cover cost containment, replica cap enforcement, model disabling, and rollback to a known-good policy.
- Under-scaling playbooks should focus on fast capacity recovery, traffic shedding, temporary threshold relaxation, and stakeholder communication when SLOs are at risk.
Each playbook should name decision owners, escalation contacts, and post-incident review steps so the team learns from failures instead of repeating them.
Conclusion: A Practical Checklist for AI-Driven Kubernetes Scaling
AI-driven Kubernetes scaling works best as an ongoing ops practice, not a one-time model or add-on.
Start with telemetry. AI-based scaling is only as good as the data feeding it, so use clean labels and keep enough retention to support trend-based automation.
Get the core autoscalers right before adding AI. Set up HPA, VPA, Cluster Autoscaler, and KEDA with clear jobs, safe limits, and the right fit for each workload.
Add predictive AI insights with guardrails, not optimism. Keep predictive scaling inside firm limits: fallback logic, replica caps, budget limits in CAD, and SLO-aware constraints.
Treat governance as part of the system. Make governance continuous: test changes, review cost, rightsize, remove idle resources, and document compliance. For Canadian teams, that includes cost visibility in CAD and records for data residency and privacy needs. Log approvals and changes in GitOps or a change log.
Work through the checklist in order, revisit it on a regular basis, and treat every scaling change like production work.
FAQs
When should I add AI to Kubernetes scaling?
Add AI to Kubernetes scaling after you’ve set up baseline autoscaling with HPA and VPA, but still see inefficiencies like over-provisioning, idle resources, or waste from zombie containers and orphaned storage.
It helps most during the action phase, where real-time monitoring and predictive demand forecasting can automate rightsizing ahead of traffic spikes and trigger scaling decisions for bursty or hard-to-predict workloads.
How do I stop predictive scaling from overspending?
Set conservative max instance limits for each service, and keep base capacity right-sized. That gives you a simple guardrail: workloads can grow when they need to, but not spiral out of control and burn through budget.
It also helps to put automated circuit breakers in place. Pause runaway jobs, shut down idle workloads after a period of inactivity, and use infrastructure as code to block expensive instance types. Think of it like putting speed governors on a fleet vehicle – people can still get where they need to go, but no one can floor it by accident.
Use hierarchical budget controls too, with alerts at 50%, 80%, and 100%. Those checkpoints help teams spot overspending early instead of finding out after the bill lands.
On top of that, review resource usage on a regular basis. If a workload can move to a lower-cost instance without hurting service-level objectives, make the switch. Small changes here can add up fast, especially across multiple services.
Which workloads are best for HPA, VPA, and KEDA?
HPA works well for consumer-facing APIs, e-commerce platforms during busy sales periods, and stateless microservices that need high availability and can deal with sudden or fast-growing demand.
VPA is a better fit when growth is steady and a single server can still handle the load. KEDA makes sense for event-driven workloads that scale based on asynchronous processing, queue depth, or event throughput.