Safety Incident Prediction: A 90-Day Pilot Blueprint

Safety incident prediction works when you feed leading indicators (near misses, inspection scores, overdue corrective actions) into a time-aware model that scores risk weekly rather than waiting for a lagging incident report. Peer-reviewed work backs this up directly: an LSTM-based forecasting framework hit 87% balanced accuracy when predicting short-term occupational accident risk from safety inspection data. The fastest path to results isn’t building a model from scratch. It’s running an AI Readiness Audit to map your existing data, then launching a pilot aligned with ISO 45001’s risk-based thinking that outputs weekly site or team risk scores.
Your first move this week:
- Inventory what you already track (inspections, near misses, maintenance logs, training records).
- Pick one site or team as a pilot scope.
- Book a readiness audit to confirm your data can support a weekly risk score before you invest in a bigger build.
Key Takeaways
Safety incident prediction succeeds when leading indicators feed a time-aware model that outputs weekly risk scores supervisors actually act on.
| Point | Details |
|---|---|
| Lead with existing data | Build your first model from inspections and maintenance logs you already collect, not a perfect future dataset. |
| Match metrics to decisions | Track balanced accuracy and F1-score, since published studies report 87% balanced accuracy and F1 of 0.8571 in comparable settings. |
| Scope a tight 90-day pilot | Pick one site, one business question, and a weekly review cadence before scaling to more locations. |
| Require explainability | Every alert needs its top contributing indicators listed, or supervisors won’t trust the escalation. |
| Start with an audit | Digitalfractal’s AI Readiness Audit maps your data against pilot requirements before you commit to a full build. |
Table of Contents
- Why Predictive Safety Analytics Actually Reduces Incidents
- What Data and Leading Indicators You Need
- Which Models and Metrics Actually Matter Here
- How to Structure a 90-Day Pilot
- Turning Risk Scores Into Daily Safety Actions
- Where Predictive Models Fall Short
- How Digital Fractal Gets You From Data to Weekly Risk Scores
- Sources
- FAQ
Why Predictive Safety Analytics Actually Reduces Incidents
Skeptics of predictive safety tools usually haven’t seen the newer numbers. Manufacturing research shows AI-enabled predictive analytics reduced near-miss frequency and lowered recordable incident rates when leading indicators were fed into forecasting models instead of sitting in spreadsheets. A separate manufacturing study using fused IIoT, video, and maintenance data reported a 42.8% mean reduction in near-miss rate and a 31.4% reduction in recordable incidents.
Two flagship metrics matter most for safety managers evaluating whether this approach is credible enough to fund:
- The LSTM sequence model reached 87% balanced accuracy forecasting daily risk aggregated into weekly scores.
- A 2026 construction study using a 7-day aggregation window reported 0.75 accuracy and an F1-score of 0.8571, and held up under 10% data noise.
The business case follows naturally from those numbers: fewer wasted inspection hours, corrective actions prioritized by actual risk instead of gut feel, and safety budgets pointed at the weeks and crews where trouble is statistically most likely.
What Data and Leading Indicators You Need
Predictive safety models are only as good as the leading indicators you feed them, and most organizations already collect more of this than they realize. Fragmented, low-quality data is the most common blocker to getting a working model off the ground, not a lack of AI sophistication.
Start with these leading indicators:
- Near-miss reports, including severity and hazard type.
- Inspection findings and numeric audit scores.
- Training and compliance completion rates by crew or shift.
- Corrective-action aging (how long open findings sit unresolved).
- Maintenance logs and equipment downtime events.
- Workforce hours, overtime, and staffing turnover.
- Weather and contextual site signals where relevant (heat, precipitation, night shifts).
Before any of that goes into a model, run it through a short prep checklist: standardize timestamps across systems, assign unique site and team IDs, apply one hazard taxonomy instead of five overlapping ones, set a minimum completeness threshold per field, and anonymize personally identifiable data before it leaves your safety management system.
Pro Tip: Don’t wait for a perfect dataset. Start with maintenance logs and inspection checklists you already run, then add one high-value field, like observation severity, to sharpen the model’s signal without adding new workflows.
Which Models and Metrics Actually Matter Here
You don’t need a data science team to pick a reasonable model family, but you do need to know what each one is good for. Logistic regression is the sensible baseline: fast to build, easy to explain to a plant manager, and useful for spotting whether your leading indicators correlate with incidents at all. Tree-based models (random forest, gradient boosting) handle messy, mixed-type safety data well and rank which indicators matter most. Sequence models like LSTM outperform both when you’re forecasting risk across time, which is exactly the binary time-series framing behind the 87% balanced-accuracy result cited above.
Match your evaluation metric to the operational decision it informs:
- Precision and recall tell you how many flagged high-risk weeks were real versus missed.
- F1-score balances those two when false negatives and false positives both carry cost.
- Balanced accuracy matters most when incidents are rare relative to normal weeks, which is nearly always true in safety data.
- AUROC and calibration checks confirm the model’s risk scores are trustworthy, not just its final yes/no calls.
Pro Tip: Use sliding-window cross-validation, not random train/test splits. Safety data is sequential, and a random split leaks future information into training, which inflates your metrics and quietly wrecks real-world performance.
How to Structure a 90-Day Pilot
A pilot succeeds or fails based on scope discipline, not model sophistication. Pick one site, or a small group of comparable sites, and answer one specific question: “Which weeks carry elevated risk for this crew?” Define your indicators up front, decide who reviews the weekly output, and agree where alerts will actually land, whether that’s a supervisor dashboard or a Monday planning meeting.
Assign four roles before you start: an executive sponsor, a safety lead who owns the business question, a data engineer who handles the pipeline, and subject-matter reviewers who sanity-check outputs against what crews are actually seeing on the ground.
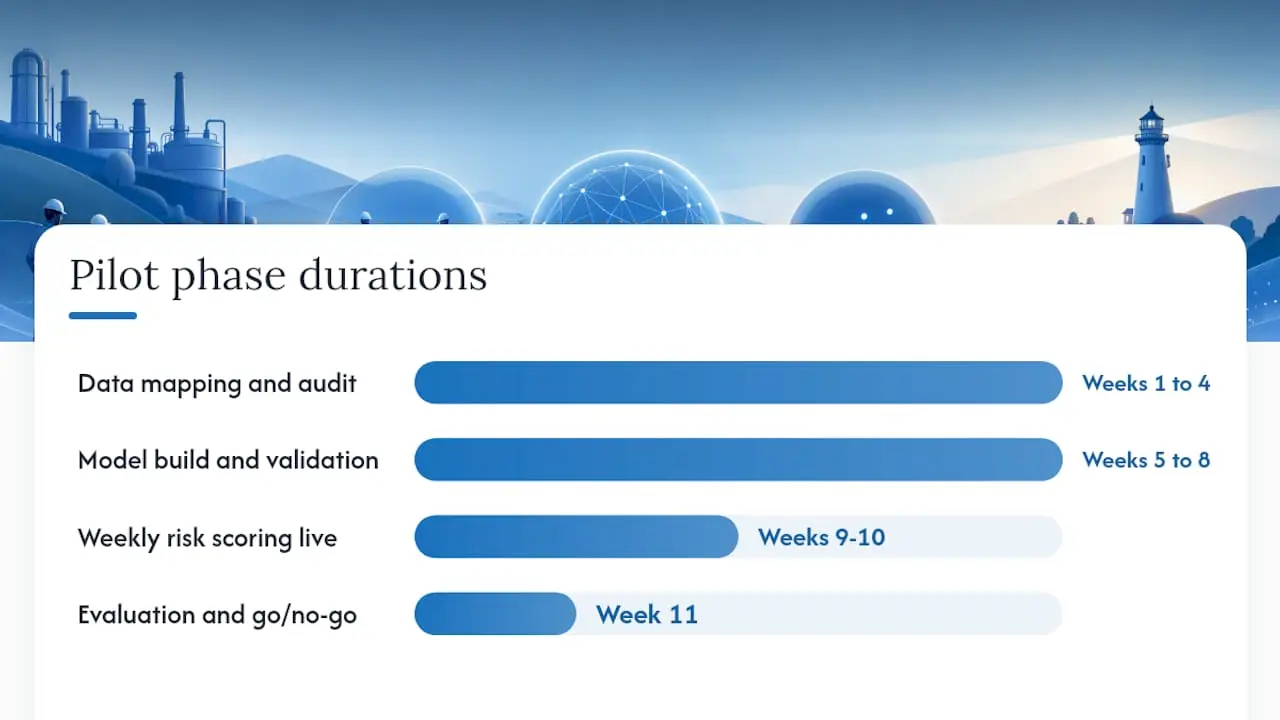
| Pilot Phase | Timeline | Key Activity |
|---|---|---|
| Data mapping and audit | Weeks 1 to 4 | Run an AI Readiness Audit; confirm indicator completeness |
| Model build and validation | Weeks 5 to 8 | Train baseline and sequence models; sliding-window testing |
| Weekly risk scoring live | Weeks 9 to 10 | Generate weekly scores; supervisor review cadence begins |
| Evaluation and go/no-go | Week 11 | Score against BA/F1 thresholds; decide on scale-up |
Set success criteria before launch, not after: a balanced accuracy above 0.7 or an F1-score above 0.75 is a reasonable bar given published construction and manufacturing results. Track adoption too. If supervisors aren’t acting on more than half of the flagged alerts, the model isn’t the problem, your workflow is.
Turning Risk Scores Into Daily Safety Actions
A weekly risk score that nobody acts on is just another report nobody reads. The pilots that stick embed the output directly into a routine: a dashboard with color-coded risk lanes by site or crew, automated alerts that fire the moment a threshold crosses, and a direct link from that alert into the corrective-action system so a flagged risk becomes a tracked task, not a Slack message.
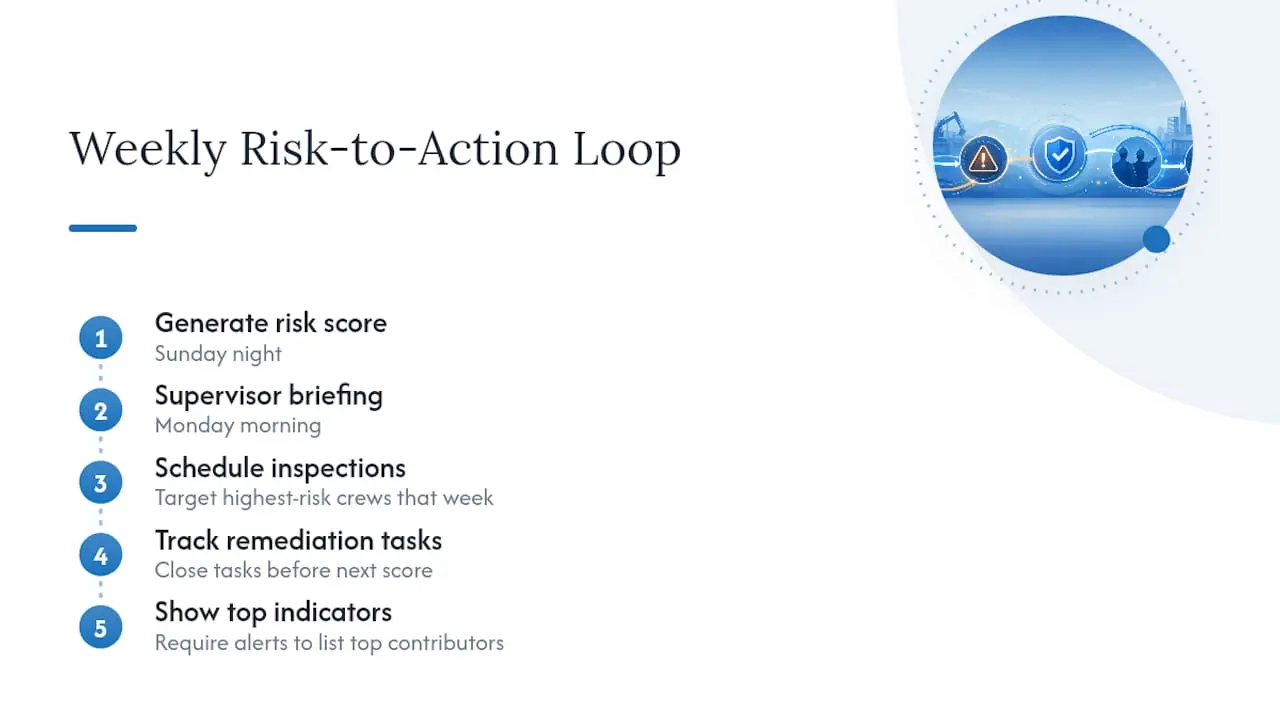
A workable weekly loop looks like this: risk score generated Sunday night, supervisor briefing Monday morning, targeted inspections scheduled for the highest-risk crews that week, and short remediation tasks tracked to closure before the next scoring cycle.
Pro Tip: Require every alert to show its top contributing indicators, not just a risk number. Supervisors who see “overdue corrective action plus rising overtime hours” trust an inspection escalation far more than a black-box score, and that trust is what determines whether they actually act on it.
Where Predictive Models Fall Short
No model overcomes bad inputs. Fragmented records, thin volumes of near-miss reporting, and drift as operations change over time all degrade accuracy, and false positives that go unexplained will burn trust with frontline supervisors fast. Explainability isn’t optional here. Teams need to see the specific indicators (fatigue signals, overdue maintenance, a spike in overtime) driving each alert before they’ll act on it.
Put governance in place before scaling past the pilot: data quality service-level agreements, role-based access controls, defined retention and anonymization rules, and a documented human-in-the-loop step for every high-risk alert.
Predictive scores should guide where to look and what to investigate. They should never become the sole basis for disciplining a worker or a crew. A model flags risk; a trained reviewer decides what it means.
A Practical Note on Adoption
We think the biggest mistake safety teams make is treating this as a technology purchase instead of a pilot. Meet your organization where it is: start with an AI Readiness Audit against the data you already collect, run a small pilot before scaling, and pair every model deployment with a governance policy your frontline supervisors actually trust.
How Digital Fractal Gets You From Data to Weekly Risk Scores
Digitalfractal runs the audit-to-pilot path in roughly 90 days: mapping your existing inspection, maintenance, and near-miss data in the first weeks, building and validating a pilot model against your own historical incidents, then handing your team a working weekly risk score integrated into supervisor briefings, not a slide deck describing what one could theoretically look like.
If you’ve read this far, you already have most of the raw material a pilot needs sitting in inspection checklists and maintenance systems you run today. What you’re missing is a structured way to test whether that data can actually forecast risk, and that’s exactly what an AI Readiness Audit is built to answer. Digitalfractal scopes the audit around your specific sites and indicators, then carries the same team through pilot build and rollout under AI integration consulting, so the model that comes out the other end fits into workflows your supervisors already run. Start with a scoping conversation and find out in weeks, not quarters, whether your data supports a working weekly risk score.
Sources
The model performance figures and methodology recommendations throughout this guide draw from a small set of peer-reviewed and industry sources worth reading directly if you’re scoping a pilot.
- DOI:10.63125/vp0mpx51
- MDPI — construction site risk prediction (2026)
- EHS Today — How AI is reshaping workplace safety and risk management
- IOS Press — AI-driven predictive safety analytics for accident prevention in smart manufacturing
FAQ
What is safety incident prediction?
It’s the practice of using historical leading indicators, near misses, inspection scores, training compliance, and similar data, run through a statistical or machine-learning model to forecast which future periods or teams carry elevated incident risk, usually expressed as a weekly risk score.
How accurate are predictive safety models?
Published results vary by industry and data quality, but recent studies report meaningful performance: an LSTM model reached 87% balanced accuracy, while a construction-focused study reported 0.75 accuracy and an F1-score of 0.8571.
How much data do I need to start a pilot?
Less than most teams assume. A few months of inspection and near-miss records is often enough to begin a pilot, though model accuracy tends to improve as you accumulate a longer history across seasons and shift patterns.
Can predictive safety analytics replace human judgment?
No. Predictive scores point safety teams toward where to look and what to investigate next. Decisions about discipline, stop-work orders, or resourcing still require a trained reviewer interpreting the alert in context.
Where should we start if our safety data is scattered across systems?
Start with an AI Readiness Audit that inventories what you already collect across inspection, maintenance, and incident-reporting systems, then scope a single-site pilot around the indicators that are most complete today rather than waiting to consolidate everything first.