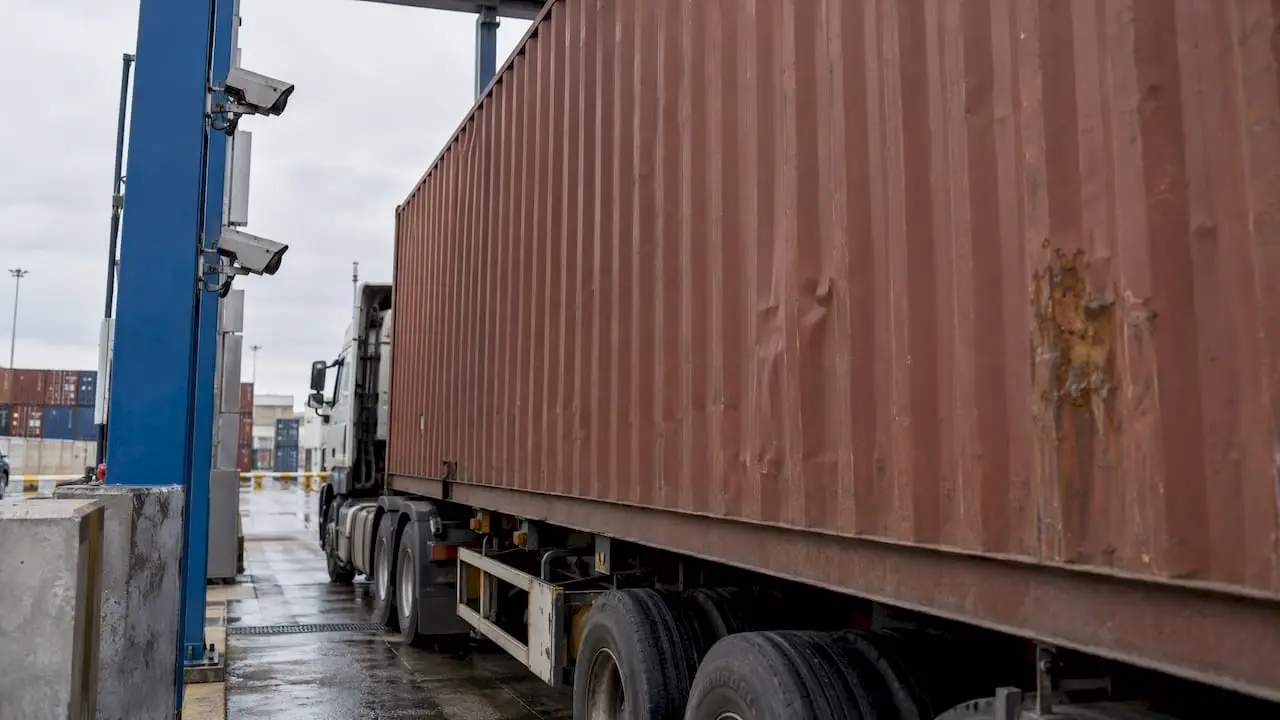
Container Damage Detection: How AI Inspection Works

Container damage detection uses cameras and computer vision models to find dents, holes, rust and other defects on shipping containers, then log them with an image, a location and a severity. Published models reach roughly 88% to 92% mAP on curated port datasets, but results depend heavily on your lighting, camera positions and the quality of your labeled images. This guide explains what the technology can detect, how it is trained, where it fits in a container workflow and what you need to put it into production.
TL;DR
- AI inspection detects dents, holes, rust, bulges and damaged fittings from images, and flags them with a bounding box and a class.
- Peer-reviewed models report mAP between about 65% and 91% depending on dataset difficulty, so your own data decides the real result.
- The most common deployment points are the gate, the quay and the rail entry, where containers already stop or slow down.
- Production use needs good camera placement, labeled images from your own yard, and integration with your terminal or logistics systems.
- A readiness audit before building tells you whether your data, cameras and systems can support the project.
Table of Contents
- What container damage detection can find
- How the detection works
- How accurate is it? What published results show
- What data you need to train and validate a model
- Where in the workflow to inspect
- What it takes to run this in real time
- Perspective
- Plan your container inspection project
- FAQ
- Sources
What container damage detection can find
A container is a steel box with a lot of surface noise: paint, logos, dirt, corrugations, reflections. The job of a model is to separate real structural damage from that noise.
Commercial gate systems show the practical range. Visy’s ADDS 2.0 detects holes and punctures, damaged handles, bent door bars, missing air-conditioning covers, dents, bulges, rust and scratches, and scores each finding on a scale. Minor classes typically score 1 to 60, moderate classes 50 to 100 and critical classes up to 100. That severity score matters as much as the detection, because it decides whether a container is waved through, flagged for review or held.
Research models usually work with fewer classes. The PPFS-YOLO study targets dents, holes and rust, which are the three classes most terminals care about first.
Telling damage from paint, dirt and rust stains
This is where most false alarms come from. The PPFS-YOLO authors point out that rust stains, peeling paint, specular reflections and embossed logos create pseudo-textures that plain spatial convolutions struggle to separate from structural defects. Their answer is to fuse frequency-domain information with edge-prior supervision, because pseudo-textures sit in frequency bands that overlap with, but differ from, genuine damage signatures.
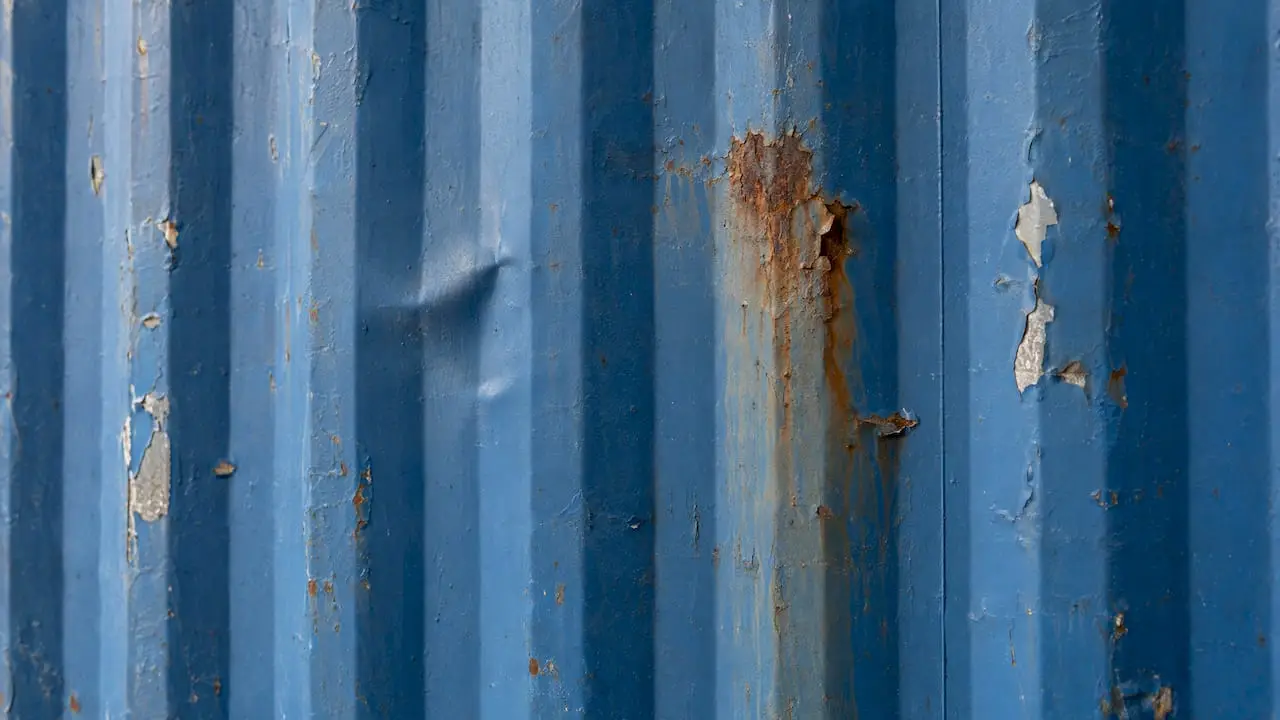
A different approach comes from the CSG-YOLO work, which models the container surface explicitly so that detections outside the container’s region are suppressed. In the reported results, false positives per image fell from 0.19 to 0.11 and detections outside the region of interest from 1.8% to 0.2%.
The practical lesson: false positives are a design problem, not just a training-data problem. Surface modeling, good lighting and clear severity thresholds all reduce the load on your human reviewers.
How the detection works
Most current systems are object detectors from the YOLO family. They look at an image once and predict bounding boxes, a confidence score and class probabilities for each object. The YOLO-NAS study describes exactly this: boxes and class probabilities locate and identify damage in container images.
A proof of concept presented at APIA 2023 used YOLOv5 (size M). It splits each image into a grid and produces boxes, object confidence and class probabilities per cell. The same system captured images inside and outside the container and recommended repairs.
If you are weighing detector families against classical image processing, our guide to YOLO versus OpenCV for object detection covers the trade-offs. For defect work in a plant setting, see our piece on computer vision defect detection, since many of the same labeling and thresholding problems apply.
Why the same model behaves differently in different setups
Teams often find that a model that looks excellent in a benchmark feels weaker once it sits inside a real product. Wrapping, prompts, tooling and runtime all change the outcome, a point explored in why the same AI model performs differently across products. For container inspection that means the camera pipeline, image preprocessing and review workflow around the model deserve as much attention as the model itself.
How accurate is it? What published results show
Accuracy numbers are not comparable across papers, because datasets, class definitions and metrics differ. Here is what the literature reports.
| Study | Dataset | Reported result |
|---|---|---|
| YOLO-NAS (2025) | 4,736 images, single damage class | mAP 91.2%, precision 92.4%, recall 84.1% |
| EB-YOLOv8 (2026) | 3,713 open-air port images | mAP@50 87.99%, mAP@50-95 60.11% |
| PPFS-YOLO (2026) | 7,013 images, 3 classes | mAP@50 64.86%, 17.2 ms per image on an RTX 3090 |
| CSG-YOLO (2026) | 4,000 images, 4,480 defect instances | 93.0 AP50 |
| Comparative arXiv study | 278 annotated images | YOLOv11 and YOLOv12 81.9% mAP@50, RF-DETR 77.7% |
A few things to read from this table:
- A harder class setup lowers the score. PPFS-YOLO’s 64.86% comes from a three-class problem with confusing textures, and it still improved on its YOLO12s baseline by 12.35 percentage points.
- Small datasets can still work for some tasks. The arXiv comparison used only 278 images, and RF-DETR, though lower overall, did better on rare damaged containers with high confidence.
- Single-class detection scores higher. The YOLO-NAS result is for one damage class, which is an easier task than separating dents, holes and rust.
Results from real terminals
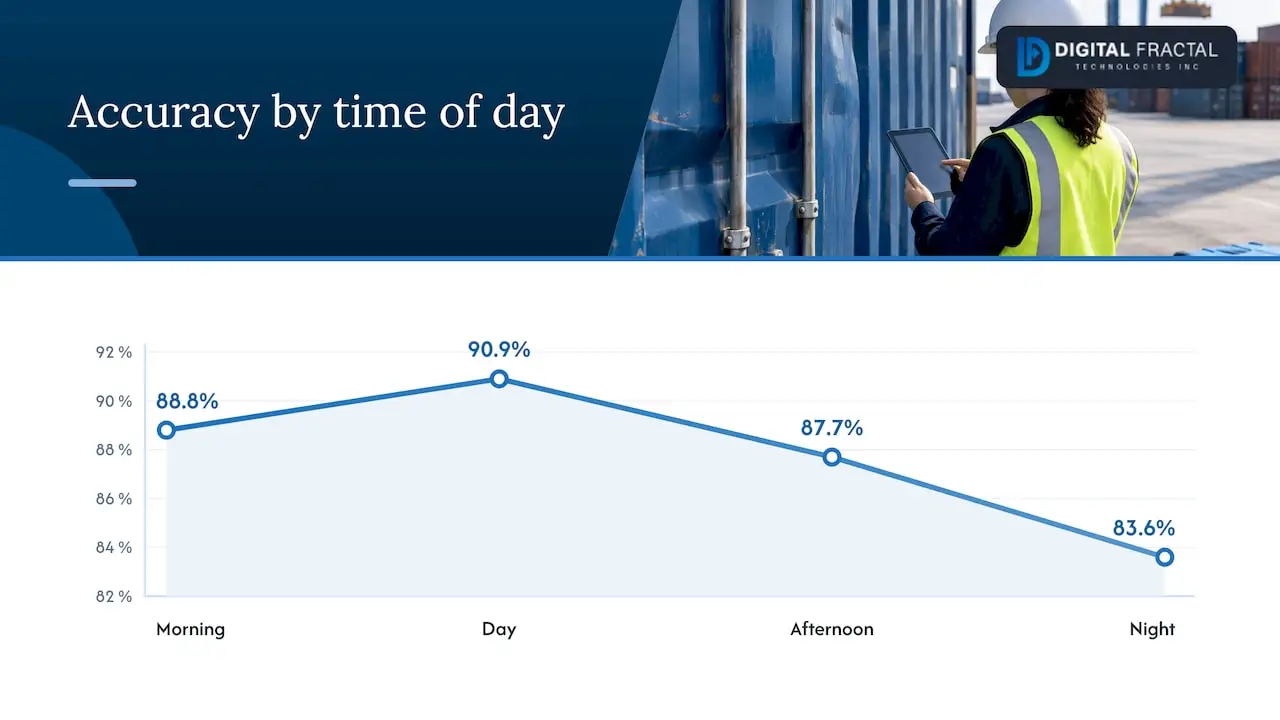
Field studies add the effect of weather and time of day. At the Makassar New Port gate in Indonesia, a YOLO-based system reached 88.8% accuracy in the morning, 90.9% during the day, 87.7% in the afternoon and 83.6% at night, with processing taking 31.1 to 33.2 seconds. Night performance dropped by several points, which is a direct argument for controlled lighting at the portal.
At EUROGATE, a real-time tracking and damage detection system trained on 1,927 labeled container images and 732 damage images, expanded by augmentation, reported mAP50 of 0.96 to 0.99 for container detection. Locating the container is the easy part. Classifying damage is where the difficulty sits.
What data you need to train and validate a model
Good labeled data is the main cost and the main risk. Three reference points help you size the effort.
- Images. The YOLO-NAS team used 4,736 images at 640×640 split 70:15:15, with 27,807 manually labeled annotations and lighting-focused augmentations.
- Conditions. The EB-YOLOv8 study gathered footage from port yards, gantry crane zones and dock fronts under varied weather and light, then split it into 2,600 training, 557 validation and 556 test images (source).
- Scarcity. Public harbor data is scarce. Researchers at Vicomtech published a synthetic labeled dataset of around 10,000 container images annotated for damage detection and segmentation, ID marker recognition and IMDG marker classification, as a way around the shortage.
For your own project, collect images from the exact camera positions you will deploy, across seasons and shifts. Label damage consistently, and agree on class definitions with your inspectors before labeling starts. If your damage records need a location reference, note that for refrigerated units ISO 9897-2:2016 defines a numerical square grid of 1,200 mm by 1,200 mm for 20 ft and 40 ft containers and 600 mm by 600 mm for 10 ft ones. Mapping detections to a standard grid makes reports easier to compare with surveyor records.
Where in the workflow to inspect
The best inspection points are where a container already pauses or passes a fixed structure.
- The gate. A portal with high-resolution cameras scans trucks as they enter or leave. At Terminal Petikemas Surabaya, the World Bank AI Repository documents an AI-enabled inspection portal at the terminal gates that identifies dents, bulges and surface deformities in real time and builds a digital inspection log.
- The quay and the crane. Cameras on gantry cranes catch damage during loading and unloading, which helps establish where damage occurred. The YOLO-NAS approach was designed for real-time inspection in dynamic port environments.
- The rail entry. Rail ramps are another controlled flow where fixed cameras work well.
- The depot or yard. Handheld or drone capture suits low-volume sites. Our work on small-object detection models for aerial imagery is relevant when drones are part of the plan.
The value of inspecting at several points is a time-stamped chain of evidence. When damage appears between the gate and the quay, you know who had custody.
What it takes to run this in real time
Terminal buyers already write these requirements into their tenders. A public request for proposals for a container terminal gate system lists automated damage inspection with severity classification, exception workflows and integration with the terminal operating system, plus links to truck appointment and port community systems. That list is a useful template for your own requirements.
In practice, a production deployment has five parts:
- Capture. Fixed cameras with consistent lighting and positions, sized to the lane width and truck speed.
- Inference. A model running at the edge or in the cloud. PPFS-YOLO’s 17.2 ms latency on an RTX 3090 shows that inference itself can be fast. Your end-to-end time will be dominated by capture, transfer and integration.
- Review. A queue where an inspector confirms or rejects flagged damage, with the image and severity score. Reviewer decisions become new training data.
- Integration. Results written to your TOS, yard system, claims workflow or a mobile app used by surveyors. APIs and event-driven workflows do most of the work here, and our page on ML API gateway design for microservices covers the pattern.
- Monitoring. Track false positives, misses and night or weather performance, and retrain on a schedule.
For logistics teams that want the results inside a driver, surveyor or customer-facing app, our mobile and web application development work covers iOS, Android and cross-platform builds.
Perspective
Most container damage projects stall for the same reason: the model is fine, but nobody mapped the data, cameras and systems it has to live inside. A strong benchmark number tells you very little about your yard at 3 a.m. in the rain.
We start from your workflow. Where do containers stop? Who decides what counts as damage? Which system needs the result, and how fast? Once those answers are clear, the model choice becomes an engineering decision rather than a gamble.
That is why we do not sell generic, off-the-shelf consulting. Our solutions are tailored to your workflows, systems and goals, and we aim for tangible business change within 90 days. For a logistics operator, that means a scoped first use case, such as gate inspection, that proves value before you widen it.
Souhail
Plan your container inspection project
If you run a terminal, depot or logistics operation in Canada and want to know whether AI inspection fits, start with our AI Readiness Audit. It is a one-off engagement priced from $2,500 to $10,000, and it identifies where automation can pay off in your operation.
After the audit, we handle AI implementation and build-out, including computer vision, and connect the results to your existing tools through workflow automation. To see how data preparation affects readiness, read our guide to enterprise data readiness.
FAQ
How accurate is AI container damage detection?
Published academic models report mAP from about 65% to 91%, depending on classes, image quality and dataset. The YOLO-NAS study reported 91.2% mAP on a single damage class, while the three-class PPFS-YOLO study reported 64.86% mAP@50. Your own result will depend on camera setup and the quality of your labeled data.
What types of damage can it detect?
Common classes are dents, holes, rust, bulges and scratches. Gate systems can also flag damaged handles, bent door bars and missing covers. Each finding is usually given a severity score so inspectors can prioritize.
How many images do I need to train a model?
Published studies range from a few hundred images to several thousand. The YOLO-NAS study used 4,736 images with 27,807 labeled annotations. More important than the count is that images come from your camera positions and cover your lighting and weather conditions.
Does it work at night or in bad weather?
Performance can drop. In the Makassar gate study, accuracy fell from 90.9% during the day to 83.6% at night. Controlled lighting at the portal and training data from all shifts and seasons are the main remedies.
Can the results feed our existing logistics systems?
Yes. Detections can be sent through APIs to a terminal operating system, claims workflow or mobile app, with a reviewer confirming flagged items. Scoping those integrations early keeps the project on schedule.
Sources
- Automatic Container Damage Detection 2.0 (Visy)
- PPFS-YOLO: Physics-Prior Frequency-Spatial Fusion
- Container-surface-guided dual-task learning for defect detection
- Automating container damage detection with YOLO-NAS (PMC)
- Automating container damage detection with YOLO-NAS (SAGE)
- Container inspection automation: a proof of concept
- Why the same AI model feels different across products
- An improved YOLOv8 model for container damage detection
- Container damage detection using advanced computer vision
- Container damage monitoring at Makassar New Port gate
- Real-time Container Tracking and Damage Detection at EUROGATE
- Methodology for generating synthetic labeled datasets
- ISO 9897-2:2016 sample
- Automatic Container Damage Detection System (TPS Indonesia), World Bank AI Repository
- Container Terminal Gate Operating System RFP