Image Recognition in Business: 7 Use Cases

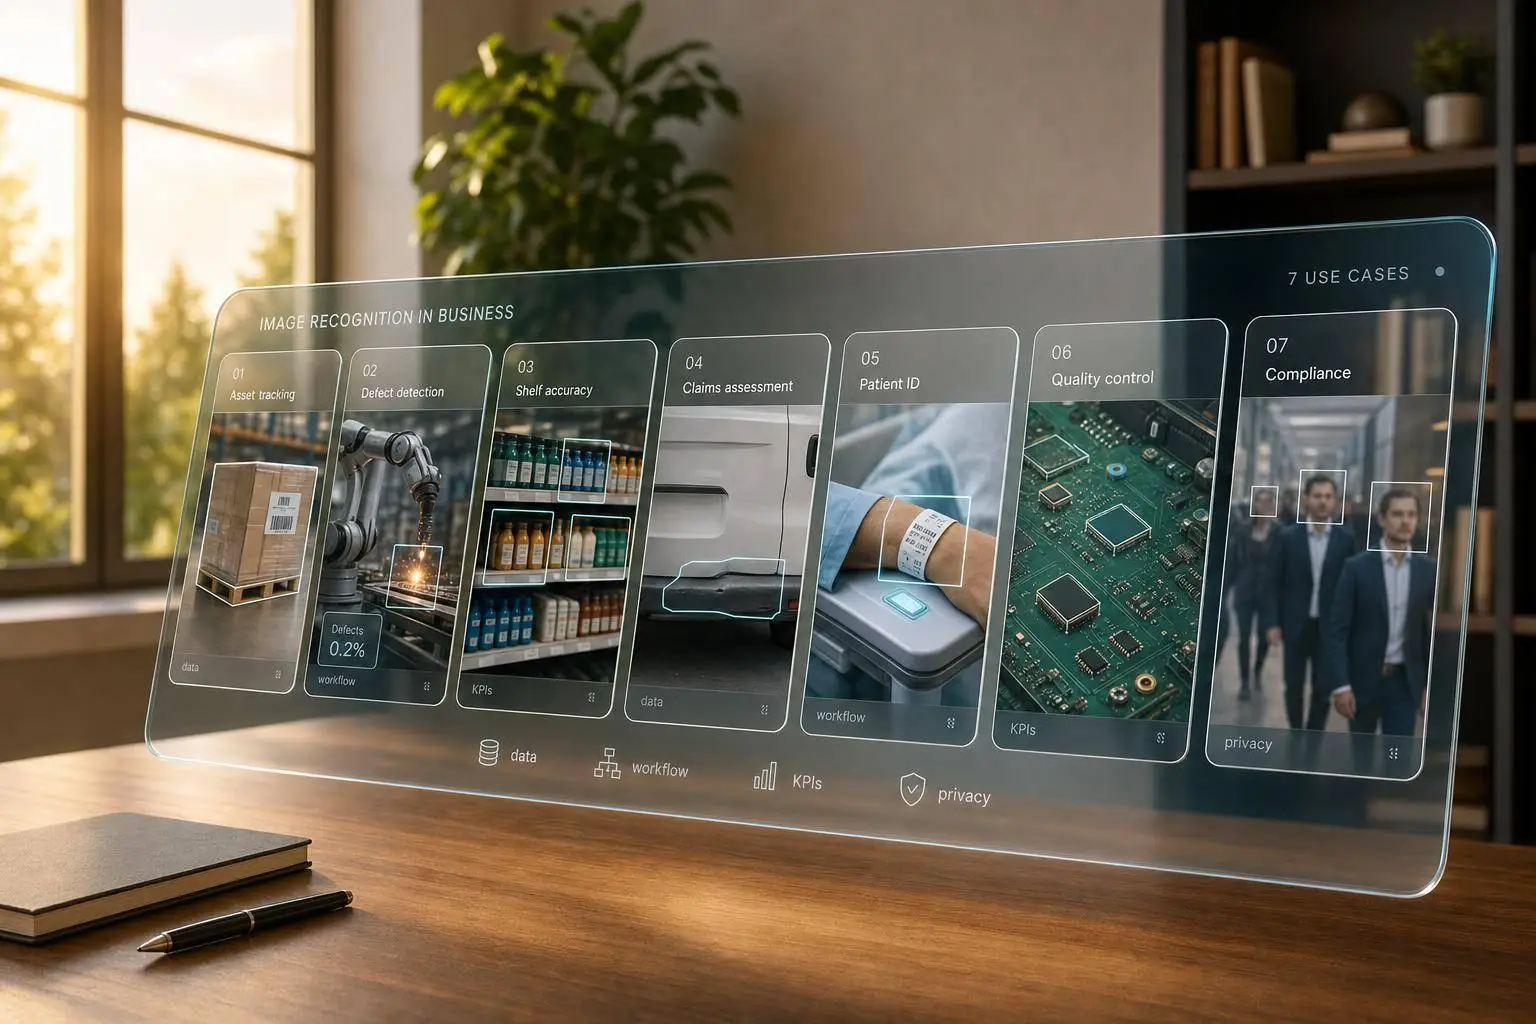
Image recognition helps businesses turn photos, scans, and video into data that can move work forward. In this article, I show how it is used for asset tracking, manufacturing quality checks, document processing, retail shelf scans, equipment inspection, insurance claims, and health record sorting.
Here’s the short version:
- I see the same pattern in every use case: image in, classification, routing, reporting
- The biggest blocker is often poor or missing labelled data
- One source in the article notes that 72% of organisations that try machine vision see limited success
- The systems work best when they connect to tools like ERP, CRM, CMMS, WMS, claims platforms, and EMR/EHR systems
- The main numbers to track are error rate, turnaround time, throughput, and hours saved
- In fields with private or sensitive data, audit logs, approval steps, and local processing rules matter from day one
These seven examples cover both physical work and paper-heavy work:
- Asset tracking with photos, OCR, and site records
- Manufacturing quality checks with line cameras and defect flags
- Document processing with OCR for forms, tickets, and reports
- Retail shelf scans for planogram checks and stock visibility
- Equipment inspection for faults like cracks, leaks, and wear
- Insurance claims review for photo sorting and damage triage
- Health record sorting for referrals, lab results, and medical images
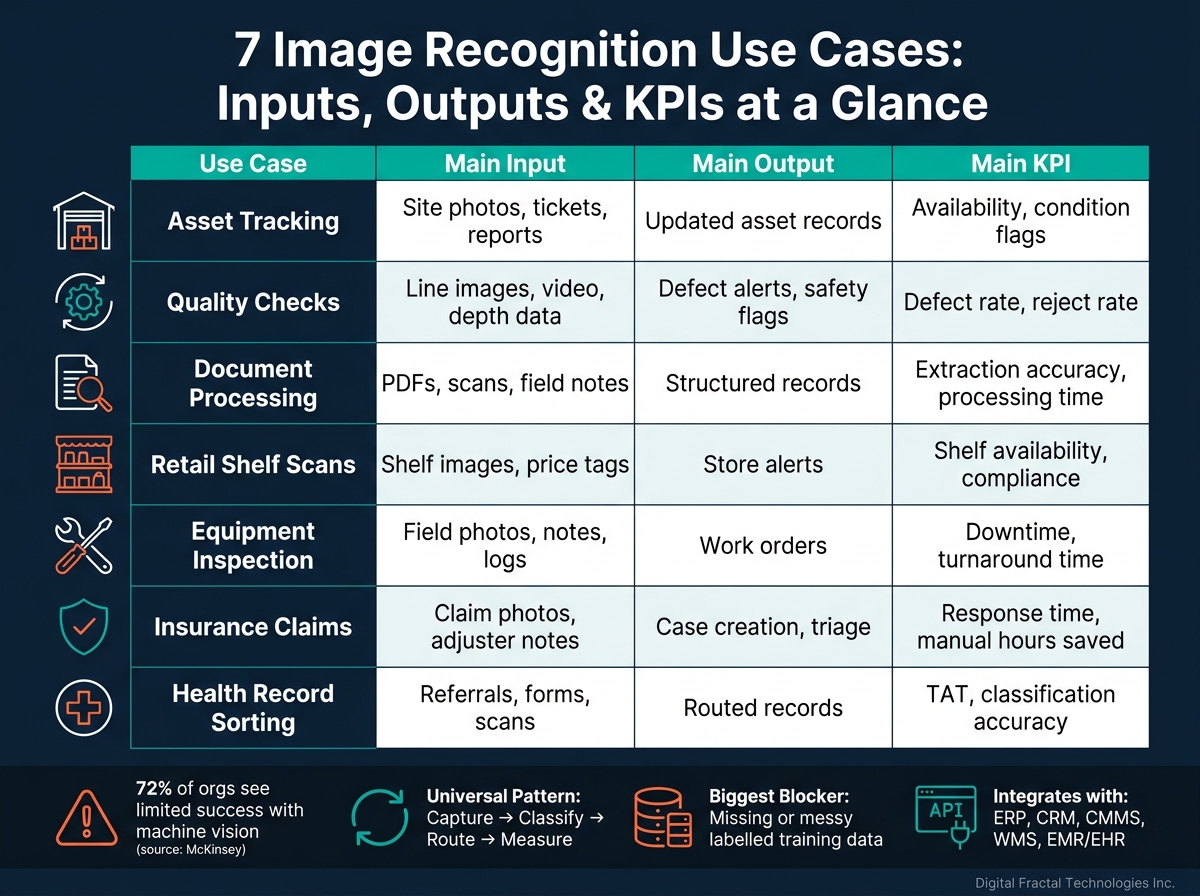
7 Image Recognition Use Cases: Inputs, Outputs & KPIs at a Glance
60 Real World Computer Vision Applications | Retail, Manufacturing and More | Ultralytics YOLO26 🚀
sbb-itb-fd1fcab
Quick Comparison
| Use Case | Main Input | Main Output | Main KPI |
|---|---|---|---|
| Asset tracking | Site photos, tickets, reports | Updated asset records | Availability, condition flags |
| Quality checks | Line images, video, depth data | Defect alerts, safety flags | Defect rate, reject rate |
| Document processing | PDFs, scans, field notes | Structured records | Extraction accuracy, processing time |
| Retail shelf scans | Shelf images, price tags | Store alerts | Shelf availability, compliance |
| Equipment inspection | Field photos, notes, logs | Work orders | Downtime, turnaround time |
| Insurance claims | Claim photos, adjuster notes | Case creation, triage | Response time, manual hours saved |
| Health record sorting | Referrals, forms, scans | Routed records | TAT, classification accuracy |
If you’re looking into image recognition, this article gives a plain-language view of where it fits, what data it needs, and how teams measure whether it is working.
What These 7 Use Cases Have in Common
All seven use cases rely on three things: clean, labelled image data, clear workflow design, and KPI tracking. The pattern stays the same in each case: capture, classify, route, and measure.
The biggest bottleneck in machine vision projects is usually training data. If labels are messy or incomplete, images won’t move cleanly into downstream workflows. McKinsey estimates that 72% of organisations that attempt to adopt machine vision meet with limited success. One of the main reasons is a lack of labelled data.
Workflow design matters just as much. Image recognition has to slot into day-to-day operations without breaking compliance. That means mapping data flows, setting up API connections to downstream systems, and defining rules for flagged exceptions. Automated workflows also need audit trails and approval steps so the capture, classify, route, report sequence stays in place.
KPIs should be set before launch, not after. The core ones here are throughput volume, error rates, turnaround time, and hours saved each week. Dashboards that show these numbers help teams make faster calls and spot model drift before output quality starts to slip.
The first application is asset tracking, where image data needs to match physical items with digital records.
1. Asset Tracking with Visual Identification
Keeping track of physical assets across warehouses, yards, and field sites gets messy fast. Equipment moves, records fall behind, and teams end up working from old information. Image recognition helps close that gap by linking camera captures to system records. That keeps asset data current across sites and sets up the workflow for reporting and alerts.
Data Inputs and Labelling Needs
The main inputs are photos of job sites and equipment, OCR scans of field tickets, and PDFs of safety reports and incident logs. Use one labelling scheme across all sites so matching stays consistent and dependable.
Workflow Integration Points
Visual data should connect straight to ERP and CMMS platforms through defined APIs, so asset records can update in real time. Field teams can then get status alerts through messaging tools. The result is simple: everyone works from the same information without extra admin work.
Reporting and KPI Outputs
| KPI Category | What Gets Tracked |
|---|---|
| Equipment Availability | Live status and scheduling |
| Condition Flags | Flags from visual inspection data |
| Resource Allocation | Operator and asset assignment |
| Incident Summaries | Auto-summaries from site photos and logs |
Compliance and Audit Requirements
Before site entry, verify toolbox talks, digital sign-offs, and subcontractor insurance IDs. Keep reminders and approvals in the audit trail so teams can show what was checked, when it was checked, and who approved it.
The same capture-to-system pattern also appears in production quality checks.
2. Quality Checks in Manufacturing and Production
Manual inspection takes time. It also varies from one person or shift to the next, and it gets tough to scale as output grows. Image recognition helps by using line-mounted vision sensors to spot defects in real time.
Data Inputs and Labelling Needs
The system depends on steady image and video feeds from vision sensors or depth cameras installed along the production line. For training, the dataset needs more than obvious faults. It should also include minor defects, common process errors, and safety non-compliance, such as missing helmets or gloves.
That matters because small issues often turn into bigger ones if no one catches them early. Semi-supervised learning can help fine-tune models with fewer, partly labelled images.
Workflow Integration Points
These vision systems can plug into current production lines through Ethernet-connected systems. From there, data can flow into MES, ERP, and maintenance scheduling systems.
If you’re dealing with sensitive image data, edge computing keeps that data on site. That setup can make day-to-day use a lot easier for teams that don’t want every image sent off-site.
Reporting and KPI Outputs
| KPI Category | What Gets Tracked |
|---|---|
| Defect Rate | Volume and type of defects caught per production run |
| Root Cause Analysis | Patterns linked to specific line conditions or equipment |
| Safety Compliance | Adherence to PPE requirements |
| Production Efficiency | Throughput versus reject rate over time |
These reports help teams see what’s going wrong, where it’s happening, and how often. A spike in rejects during one shift, for example, may point to a line setting, a worn part, or a process step that needs attention.
Compliance and Audit Requirements
Image recognition can also log PPE use and flag incidents as they happen. That supports audit trails and health and safety records without adding another manual check.
In the same workflow, the system can flag missing PPE and record exceptions for review.
The same capture-to-workflow pattern carries into document processing, where scans become structured records.
3. Document Processing and Intelligent Capture
The same visual pipeline can do more than spot defects. It can also read documents.
That matters because paper-heavy work slows everything down. Field tickets, safety reports, invoices, and vendor contracts all have to be read, entered, and filed. OCR-based capture turns those documents into structured data on its own, which cuts out the in-between manual work.
Data Inputs and Labelling Needs
The system can work with many document types, including PDFs, scanned forms, photos of field notes, and incident photos. In construction and energy, that often means field tickets and safety reports arriving in all kinds of formats. It’s messy in a very normal way.
Semi-supervised models can learn from partly labelled data, which lowers the amount of labelled training data needed at launch.
Workflow Integration Points
Once data is extracted, it can move into ERP, CRM, and approval systems through APIs. That means updates can happen without someone typing the same details in again.
The same pipeline can also automate:
- approval routing
- status notifications
- exception handling for more complex cases
This cuts manual entry and lets staff focus on the exceptions that still need a human eye.
Reporting and KPI Outputs
You’ll want to track extraction accuracy, processing time, and error rate. Those numbers show whether the system is doing the job or just adding noise.
AI-driven document processing can cut turnaround times from hours to seconds. Setting these KPIs during the discovery phase makes it much easier to measure whether the system is paying off over time.
Compliance and Audit Requirements
Edge processing keeps sensitive documents on site instead of sending them to a central cloud. For many teams, that’s a big deal.
Automated workflows can also create audit trails and send reminders for documents like WCB certificates or insurance certificates, so nothing slips through the cracks during vendor or subcontractor onboarding. The same capture-and-route pattern then carries into retail shelf scans.
4. Retail Shelf Scans and Planogram Compliance
Retail teams use image recognition to check product placement, facings, and price tags across aisles. Cameras scan shelves in real time and flag out-of-stocks, misplaced items, and pricing errors, so staff don’t have to manually count facings.
Data Inputs and Labelling Needs
The system needs high-quality shelf images that show product type, size, placement, and price tags. Depth cameras add depth data, which helps the model tell whether a product is actually in position and whether facings are adequate.
One issue shows up fast in multi-store rollouts: shelf layouts often vary from one location to another. That can make scaling harder. Standardising shelf formats before rollout can cut down on rework later.
Workflow Integration Points
Once an image is captured, the system flags non-compliance and routes the alert to store staff or the merchandising team. Processing can happen at the edge, so images are analysed on-site and alerts are flagged faster.
This creates a direct feedback loop between the merchandising plan and what is actually on the shelf. In plain terms, the scan leads to action, and action feeds reporting.
Reporting and KPI Outputs
The metrics that matter most here include:
- Shelf availability rate
- Shelf layout compliance
- Share of shelf
- Task completion rate
Image evidence can support internal reporting and give teams a clear record of shelf conditions over time.
Compliance and Audit Requirements
Edge processing helps keep sensitive image data closer to the store and supports privacy-focused workflows. Audit logs record shelf conditions over time and support store-to-store review.
The same image-to-workflow pattern also applies to equipment inspections, where teams track condition instead of shelf placement.
5. Equipment Inspection and Predictive Maintenance
In industrial and field-based operations, equipment problems usually don’t wave a flag before they hit. By the time a technician notices corrosion, a crack, a leak, or overheating, the damage may already be in motion. Image recognition gives teams a way to spot those issues earlier using photos taken on-site.
The process starts in the field. Technicians send in photos and notes, and the system flags defects, creates maintenance tasks, and logs each issue for follow-up. In plain terms, field inspections feed straight into the maintenance process instead of sitting in a separate queue.
Data Inputs and Labelling Needs
The model needs labelled images that show the full range of failure types, including:
- corrosion
- cracks
- leaks
- wear
- overheating
Equipment logs, incident logs, field notes, and safety reports help fill out the training dataset. A dedicated build-and-train phase is usually needed to fit the vision model to specific equipment types and site conditions.
Workflow Integration Points
After the system flags an issue, it sends the item to maintenance without manual re-entry. It can automatically create a work order in a connected CMMS or ERP platform, while a scheduling agent assigns operators and resources based on real-time availability.
Field workers can also submit inspection photos through tools like Slack, WhatsApp, or SMS. That matters in the real world, because the easier it is to send a photo from the field, the more likely the issue gets logged right away. Continuous monitoring also helps teams spot problems between scheduled inspections.
Reporting and KPI Outputs
Track scheduled versus unscheduled downtime, turnaround time, and hours saved.
Compliance and Audit Requirements
Each inspection should be recorded in the audit trail. Safety form completions, sign-offs, and HSE documentation are tracked in that same record.
6. Insurance Claims Review and Damage Assessment
When a claim comes in, image recognition can sort photos, pull out damage details, and send the file to the right place much faster. That matters most when a claim needs to move straight into handling without someone stopping to review every image first.
Automated review can shrink response time from hours to seconds. But speed alone isn’t enough. The model also needs to be trained on claim-specific damage labels so it can tell one type of loss from another with fewer mistakes.
Data Inputs and Labelling Needs
Use labelled claim photos, loss-type tags, and adjuster notes during training. Keep damage labels consistent across property, auto, and liability files. If one team tags cracked glass one way and another team uses a different label, things can get messy fast.
Workflow Integration Points
Photos sent by SMS, WhatsApp, or a web form should open a case on their own. If the images are blurry, incomplete, or hard to classify, they should go straight to an adjuster queue instead of getting stuck in limbo.
Reporting and KPI Outputs
| Output | What It Tracks |
|---|---|
| Claim response time | Time from photo submission to case creation |
| Manual effort recovered | Hours saved by eliminating manual data entry |
| Incident summary reports | Structured summaries generated from claim photos and incident logs |
| Traceable decision records | Audit trails and approval records for each claim |
Compliance and Audit Requirements
Log every automated decision, adjuster override, and approval. Add role-based access and encryption for claimant data. For sensitive images, edge processing helps keep files on site during intake instead of sending them elsewhere.
The same image-to-workflow pattern also applies in healthcare, where records and scans need to be sorted fast.
7. Health Record Image Sorting and Medical Imaging Workflows
Healthcare teams handle a steady stream of scanned referrals, lab results, forms, and medical images. Sorting all of that by hand takes time, and mistakes can slip in. This use case follows the same core flow as the others: capture, classify, route, and log.
Image recognition can identify incoming files and send them to the right place on its own, whether that’s an EHR index, a PACS queue, or an administrative folder. The result is simple but important: unstructured intake becomes structured, traceable work.
Data Inputs and Labelling Needs
Train the system on labelled PDFs, OCR scans, and photos so it can sort referrals, lab results, forms, and images the right way. When full labels are hard to get, partially labelled cases can still help fine-tune the model. That matters in healthcare, where data is often messy and time for manual prep is limited.
Workflow Integration Points
Connect the sorter to EHR and EMR systems through APIs so records move to the right queue automatically. Background processing keeps intake moving in parallel, without getting in the way of clinical or administrative work.
Reporting and KPI Outputs
| Metric | What It Tracks |
|---|---|
| Turnaround time (TAT) | Time from image intake to classified and routed record |
| Classification accuracy | Rate of correctly identified document or image types |
| Routing accuracy | Rate of correctly classified records |
| Exception rate | Files sent for manual review |
These metrics give teams a clear read on day-to-day performance. If turnaround time starts to creep up, or exception rates jump, staff can spot the issue early instead of finding out after a backlog builds.
Compliance and Audit Requirements
Sensitive health records need strong privacy controls. Keep processing on-device or inside approved geographic boundaries, and log every automated action, approval, and reminder.
A comparison table makes intake, routing, and compliance differences easier to scan.
Where Comparison Tables Add Clarity
For use cases with clearer trade-offs, a comparison table is often the fastest way to show what changes. Two cases stand out for side-by-side comparison: retail shelf scans and insurance claims review. Like choosing between custom mobile apps vs. off-the-shelf solutions, these use cases require weighing specific operational needs against implementation speed.
Manual Shelf Audits vs. AI Shelf Scans
Retail shelf scans are easiest to compare by cadence, labour, and visibility.
| Metric | Manual Shelf Audit | AI Shelf Scan |
|---|---|---|
| Audit Time | High; time-consuming manual work | Fast; completed in a fraction of the time |
| Compliance Visibility | Periodic snapshot (weekly or monthly) | Continuous/real-time visibility |
| Labour Requirements | High; substantial labour required | Low; minimum human intervention required, camera-based automation |
Continuous monitoring spots shelf issues sooner than periodic walkthroughs. That matters on the ground: a weekly or monthly check can show you what went wrong, but not always when it started. A camera-based system gives teams a steadier view of compliance and stock conditions.
Claims review works a bit differently. Here, the comparison is less about store cadence and more about speed versus risk.
AI Insurance Claims Review: Benefits vs. Risks
AI-assisted claims review speeds triage, but privacy, label quality, and drift still need close control.
| Claims Phase | Key Benefits | Risks |
|---|---|---|
| Triage & Intake | Faster triage; response times from hours to seconds | Data privacy; handling of sensitive customer information |
| Damage Assessment | Faster extraction from claim photos and PDFs | Data quality; limited labelled data for rare cases |
| Final Review | Reduced administrative burden; consistent decision logic | Model bias or data drift over time |
The retail comparison is about operating rhythm. The claims comparison is about control. If claim patterns shift over time, drift can quietly chip away at accuracy. Continuous monitoring helps teams catch that early, before small misses turn into larger review problems.
Implementation Factors to Consider Across Industries
The use cases may change, but the rollout checklist doesn’t. Across all seven use cases, four things shape success: image quality, model training, exception handling, and privacy.
Image quality comes first. In any of the seven use cases, some tasks call for high-resolution sensors or 3D imaging. Steady resolution and lighting standards help cut noise before it ever reaches the model.
Model training and drift aren’t one-and-done jobs. They need attention over time. Across these workflows, teams should plan for labelled data, monitoring, and periodic retraining. Edge processing keeps data closer to where it’s captured, and retraining is still needed to manage drift as time goes on.
Exception review workflows should be locked in before go-live. In each of the seven use cases, routine cases can move through the system automatically, while exceptions go to human reviewers. In compliance-heavy fields like insurance and healthcare, set exception thresholds and human review ownership before launch.
Privacy controls matter even more in Canada. Here’s the short version: align retention, access, and data-handling rules with Canadian federal and provincial privacy requirements. Those controls often decide whether a pilot can grow or whether it runs into compliance or workflow gaps.
Conclusion
Put these examples side by side and the pattern is clear: capture, classify, route, measure. The use cases work best when image data, routing rules, and reporting are part of the workflow from day one.
The best setups do more than detect images. They turn images into structured data that kicks off action and tracks results – with faster processing, fewer manual checks, and cleaner audit trails. That’s what shifts image recognition from a point solution into a tool teams can use day to day.
If you’re looking at image recognition for your operations, Digital Fractal Technologies Inc. can help define the data, workflow, and reporting needs for a custom solution.
FAQs
How much labelled data do I need to start?
You may not need as much data as you once did. Older machine learning setups often needed thousands of images. Newer methods can do the job with smaller datasets or data that’s only partly labelled.
With semi-supervised learning, teams can fine-tune models without spending huge amounts of time building massive, fully annotated datasets. Digital Fractal Technologies Inc uses these efficient machine vision methods to help Canadian businesses get started with a smaller initial dataset.
Which KPI should I track first?
Start by pinning down the problem you want to fix first, like inventory management or quality control. That keeps the project focused and makes it much easier to judge whether the system is doing its job.
Then run a small pilot before rolling anything out across the business.
During that pilot, track KPIs tied directly to your goal, such as:
- forecast accuracy
- inventory turnover
- stockout reduction
These metrics show whether the AI is cutting inefficiencies before you commit to a full rollout.
When should image processing stay on-site?
Image processing should stay on-site when you need sub-second latency for real-time tasks like life-safety alerts, exclusion-zone breaches, or robotic adjustments.
It also matters when privacy rules say sensitive data, such as identifiable faces, must be blurred before it leaves the facility. And if your internet connection drops, local processing keeps things running instead of bringing operations to a halt.
In many cases, a hybrid setup gives you the best of both: fast on-site response for immediate needs, plus cloud analytics for longer-term analysis.