How Computer Vision Enhances Heatmap Analytics
Computer vision transforms how businesses use heatmaps by analysing video data to track movement and generate detailed spatial insights. By combining cameras with AI models, these systems detect objects like people, map their positions, and create colour-coded heatmaps that highlight activity levels in physical spaces. This technology is helping Canadian retailers, warehouses, and public spaces optimize layouts, improve workflows, and make informed decisions based on real-world movement patterns. Key benefits include:
- Retail Insights: Identify high-traffic areas to adjust product placement and boost sales.
- Operational Efficiency: Streamline workflows in warehouses and factories by reducing inefficiencies.
- Space Utilization: Optimize public spaces by identifying underused areas and bottlenecks.
With tools like YOLO models for detection and heatmap customizations, businesses can track dwell times, paths, and even automate actions like queue notifications. Computer vision-powered heatmaps provide actionable data for smarter, data-driven decisions across industries.
How to Transform Retail Analytics Using Ultralytics Heatmaps | Episode 75
sbb-itb-fd1fcab
How Computer Vision Powers Heatmap Analytics
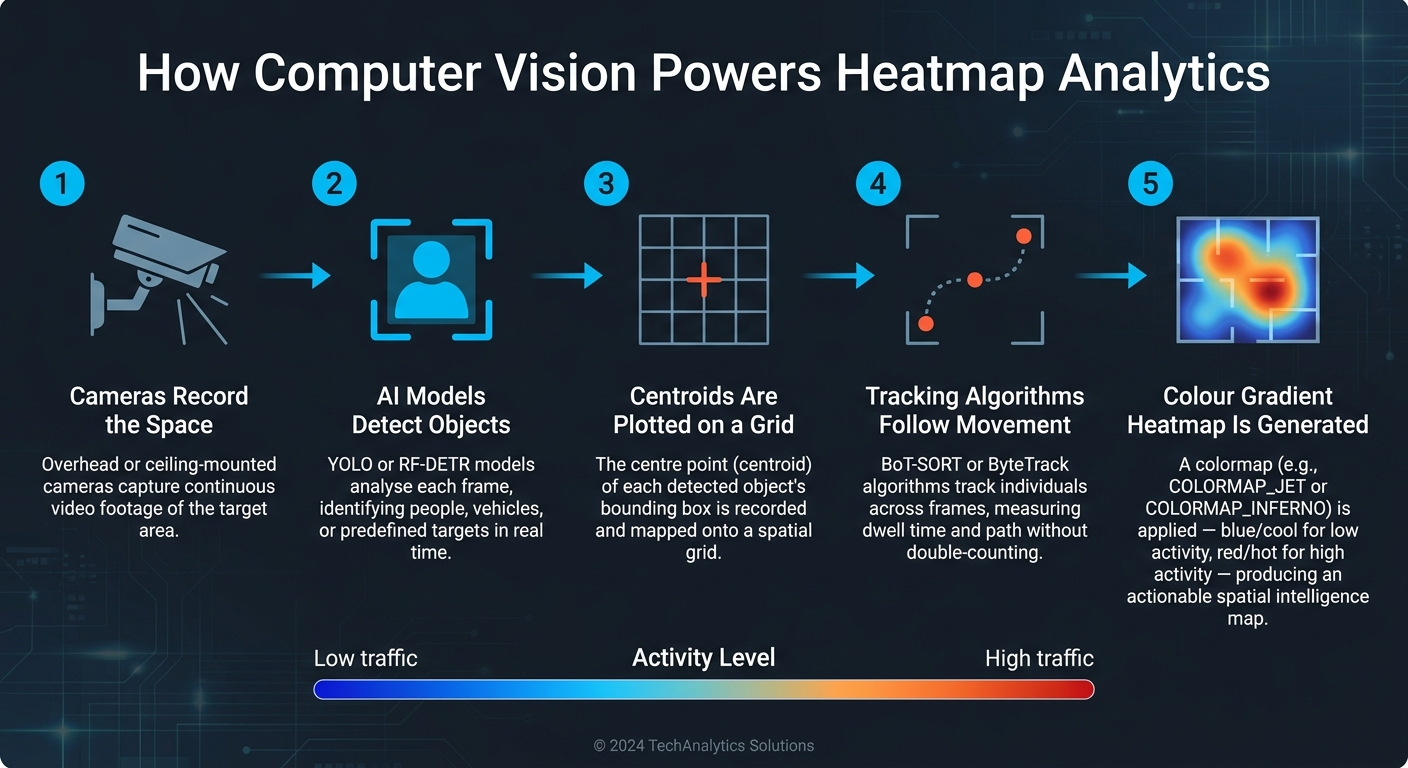
How Computer Vision Generates Heatmap Analytics: Step-by-Step
Heatmap systems driven by computer vision turn raw video footage into detailed spatial insights.
How Heatmaps Are Generated
The process begins with cameras capturing video of a specific area. This footage is then processed through a computer vision system, where AI models analyse each frame to identify objects like people, vehicles, or other predefined targets. For every object detected, the system records its centroid (the centre of its bounding box).
These centroid coordinates are mapped onto a spatial grid aligned with the camera’s view. Over time, a colour gradient – or colormap – is applied to represent detection frequency visually. Popular colormaps include COLORMAP_JET (a blue-to-red gradient) and COLORMAP_INFERNO (a high-contrast black, red, and yellow palette). The choice of colormap matters; selecting the wrong one can obscure subtle patterns in the data.
"This simple visualization transforms hours of video into actionable spatial intelligence." – Falguni Chatterjee, Founder & CEO, Aptibit Technologies
Beyond basic data collection, AI-powered object detection and tracking enhance these insights further.
Object Detection and Movement Tracking
What sets computer vision–powered heatmaps apart from older motion-detection systems is their ability to filter out irrelevant movement. Traditional motion sensors often pick up unnecessary elements like shadows or outdoor disturbances. In contrast, AI models such as RF-DETR (a transformer-based architecture) and YOLO are trained to identify specific object types, ensuring only relevant data is captured .
"The real differentiating factor here is identifying if an object/movement is a person in real-time before a heat map is generated. This allows our Heat Map to be much more accurate to the movements of people throughout the day." – Montavue
Once an object is identified, tracking algorithms like BoT-SORT or ByteTrack follow it across multiple frames. This enables the system to measure not just the number of people passing through an area but also how long they stay in one spot. Such metrics are especially useful in scenarios like retail environments or AI-driven workspace planning.
These advanced tracking methods pave the way for real-time data analysis.
Real-Time Data Processing and Visualization
Modern computer vision systems are capable of processing data end-to-end, from live video input to object detection, tracking, and heatmap updates – all in near real time. Justin Kim, a Computer Vision Consultant at Roboflow, highlights the efficiency of these systems:
"RF-DETR’s performance in handling occlusions and motion blur, maintaining high detection confidence even in tricky lighting… offered near real-time inference – critical if you want to deploy heatmaps on live video feeds." – Justin Kim, Roboflow
Additionally, perspective correction ensures that the system accounts for camera distortion, allowing for consistent and accurate data across the entire field of view.
Where Computer Vision-Powered Heatmaps Are Used
Computer vision-powered heatmaps are proving useful across a variety of industries, offering insights that help organizations make informed decisions. In Canada, businesses and public entities are already tapping into these tools to optimize their operations.
Tracking Customer Behaviour in Retail
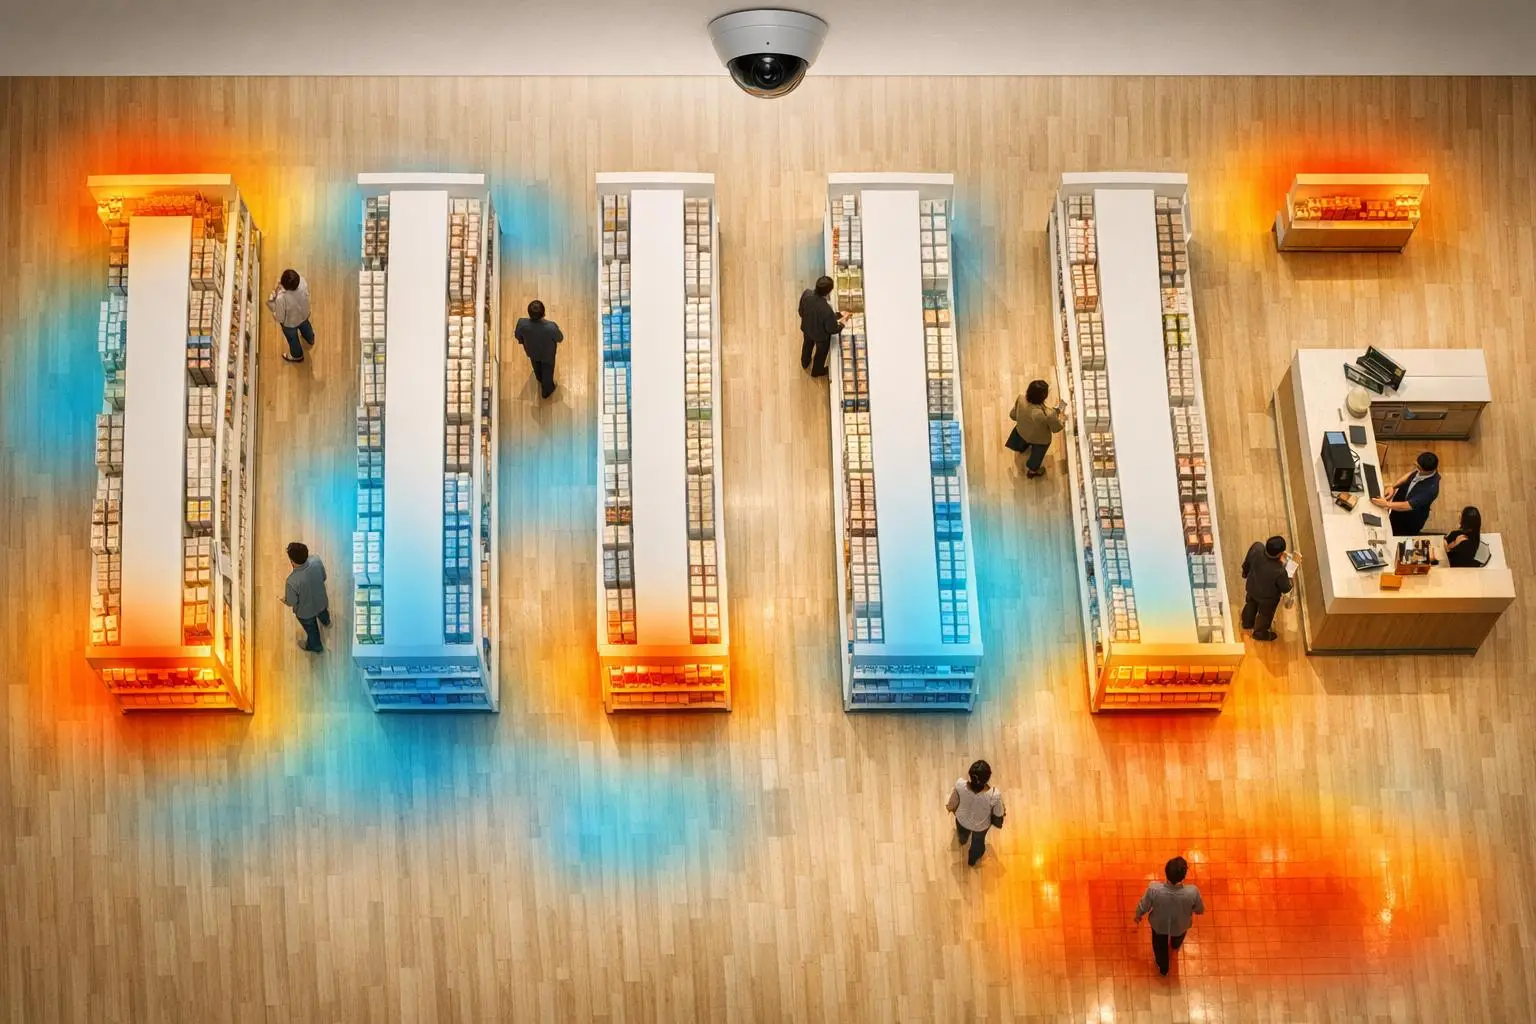
Retailers are using computer vision-powered heatmaps to understand customer movement within their stores. These heatmaps reveal where shoppers walk, pause, and engage with products. Areas with high activity, or "hotspots", show where foot traffic is concentrated, while less visited "cooler zones" indicate areas that may need attention. This data helps retailers reorganize shelves, reposition displays, and adjust product placement to encourage traffic in underperforming sections.
"Without data, layout changes are just guesses."
Retailers leveraging AI-based in-store analytics have reported a 15–20% boost in efficiency and sales. Such insights are invaluable for businesses aiming to maximize the utility of their retail space while improving overall performance.
Improving Workflow Efficiency in Operations
Heatmaps aren’t just for retail – they’re transforming workflows in warehouses, factories, and construction sites. By overlaying heatmap data onto facility layouts, operations managers can identify inefficiencies like overlapping routes or underused zones. For example, they can optimize forklift paths or reduce the distance workers travel to retrieve inventory. Organizations using this type of analysis have seen inventory costs drop by as much as 30%. Additionally, analysing areas where workers spend excessive time can highlight ergonomic risks that need addressing.
Space Utilisation in the Public Sector
Public sector organizations are also benefiting from these insights. Libraries, community centres, transit hubs, and government offices are using heatmaps to manage shared spaces more effectively. These tools provide detailed spatial intelligence, showing not only how many people enter a facility but also how they navigate it, where they linger, and where bottlenecks occur.
This information helps administrators make smarter decisions. For instance, underused meeting rooms can be repurposed, while areas with long wait times may signal the need for more staff. Heatmap data can even be integrated with building management systems to automate lighting and HVAC adjustments, cutting energy costs in less occupied zones. For renovations or new construction, this data replaces guesswork with real behavioural insights – a practice known as evidence-based facility design.
Canadian organizations can turn to tailored solutions from companies like Digital Fractal Technologies Inc (https://digitalfractal.com) to harness these insights and make data-driven decisions that improve efficiency and effectiveness.
How to Implement Computer Vision for Heatmap Analytics
Creating a computer vision heatmap system involves three key components: the right hardware, well-trained AI models, and a setup tailored to your specific goals.
Setting Up the Hardware and Software
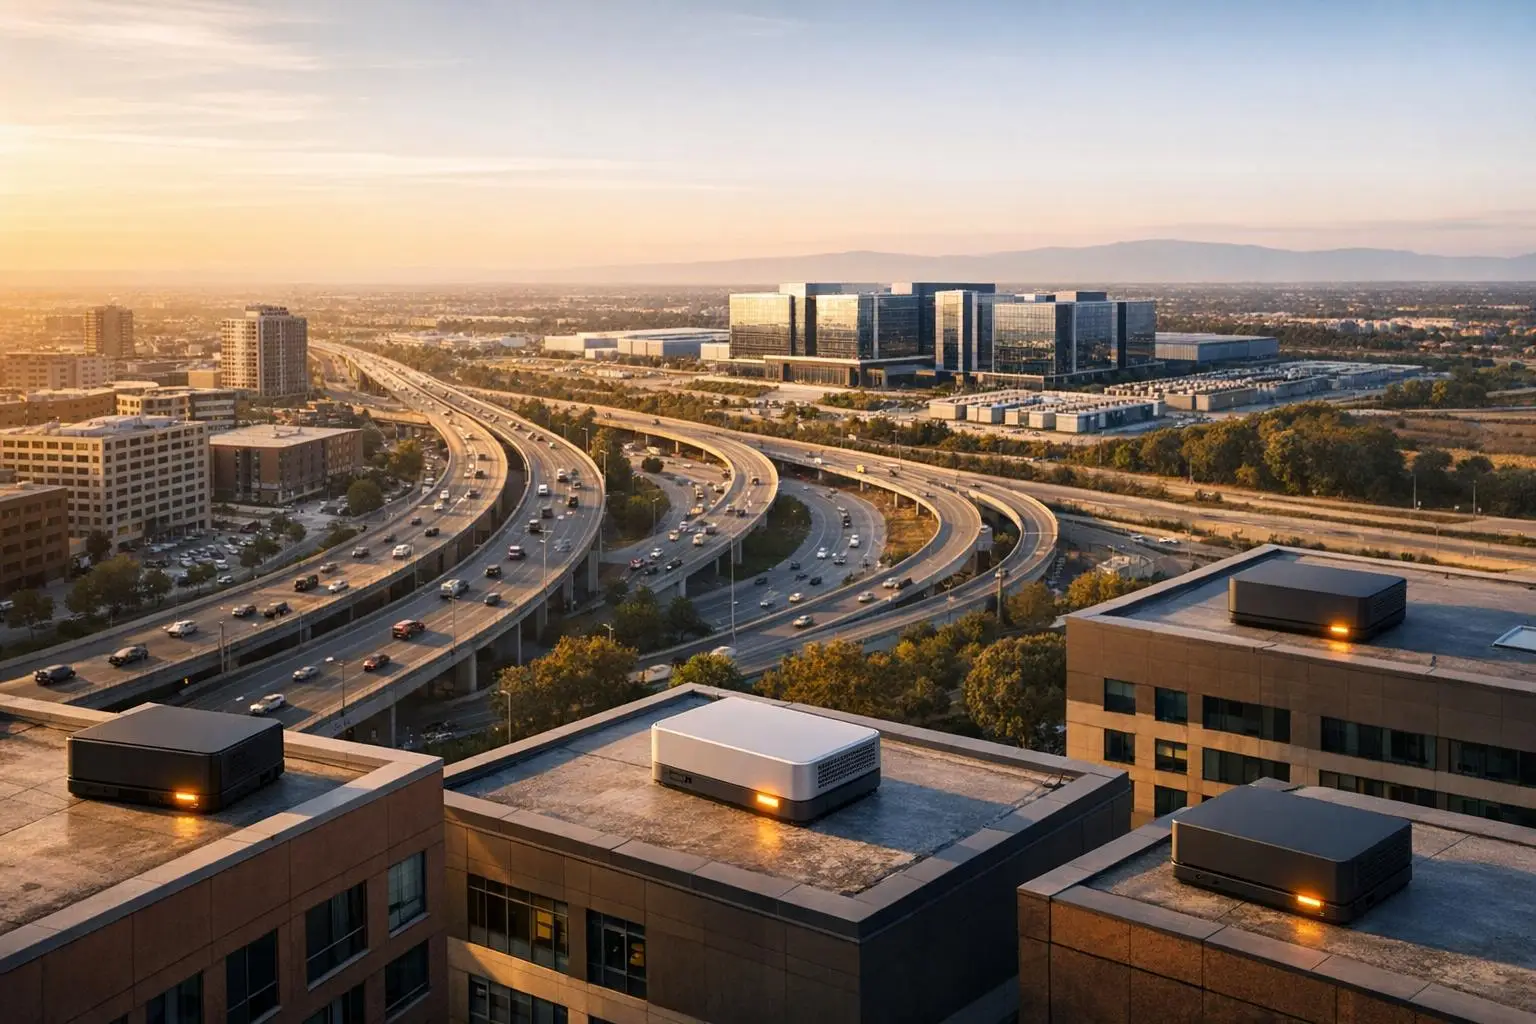
The backbone of any heatmap system is a reliable camera setup. Overhead or ceiling-mounted cameras are ideal for tracking people as they minimize obstructions and provide a clear top-down perspective. For larger spaces, fisheye cameras like the Montavue MTF12360-AI can cover 360° from a single unit. These cameras are typically connected via PoE (Power over Ethernet) switches, which allow both power and data to run through a single cable.
On the processing side, Nvidia GPUs are a popular choice for real-time analysis, thanks to their CUDA acceleration. If on-site hardware isn’t practical, cloud-based services such as Microsoft Azure Computer Vision, Amazon Rekognition, or Google Cloud Vision API offer flexible, pay-as-you-go options. Microsoft Azure even provides free test access to its Computer Vision API, making it a great starting point for teams testing the waters.
For software, the toolkit often includes OpenCV for image processing, TensorFlow or PyTorch for running AI models, and Python libraries like NumPy and Matplotlib for data normalization and rendering the final heatmap.
Using AI Models for Data Analysis
The AI model is what turns raw video into actionable insights. YOLO models, especially YOLOv8 and the newer YOLO26, are widely used for real-time person detection. These models excel at filtering out false positives from common distractions like shadows or moving objects, which often confuse older motion-detection systems. For more complex scenarios, transformer-based models like RF-DETR handle challenges like motion blur and overlapping objects more effectively.
Once a person is detected, the system calculates their centroid – the centre of their bounding box. These coordinates are plotted on a spatial grid, building the heatmap over time. Advanced tracking algorithms such as BoTSORT or ByteTrack ensure individuals aren’t counted multiple times as they move, while perspective correction adjusts for distortions near the edges of the camera’s field of view. This ensures consistent and accurate heatmap data across the entire area.
With this level of precision, the system can be customized to suit specific needs.
Customizing Heatmaps for Your Business Needs
Heatmaps can be tailored to focus on areas that matter most to your business. For instance, you can define custom Regions of Interest (ROIs) to highlight specific zones like checkout lines, promotional displays, or workstations. You can also filter by object class to track only customers while excluding staff or equipment.
Time-based configuration adds another layer of flexibility. By setting the system to collect data over specific intervals – such as hourly, daily, or custom time frames – you can compare traffic patterns, whether it’s weekday versus weekend activity or the impact of a new store layout. The heatmap’s appearance can also be adjusted with colour schemes like Inferno, Magma, or Viridis to match your reporting style.
For businesses that require more than just observation, heatmaps can trigger automated business processes. For example, the system could send a notification when a queue exceeds a certain length, making it a proactive tool.
For Canadian companies, working with Digital Fractal Technologies Inc can simplify the entire process. Their expertise in AI consulting and custom software development ensures a seamless integration of the heatmap system into your operations, aligning it perfectly with your workflow instead of forcing you to adapt to generic solutions.
Benefits and Metrics of Computer Vision-Driven Heatmap Analytics
Computer vision-driven heatmap analytics go beyond basic tracking, offering detailed insights that manual methods simply can’t match. These systems generate rich data that not only measures activity but also helps drive meaningful decisions.
Deeper Insights for Better Decision-Making
While traditional people counters only track the number of visitors, heatmap analytics powered by computer vision reveal where visitors go, how long they stay, and the paths they take. This level of detail turns raw numbers into actionable insights that can reshape strategies.
Two key metrics stand out: Dwell Time and Path Analysis. Dwell Time identifies areas where people linger the longest, making these spots ideal for showcasing high-margin products or delivering impactful messaging. Path Analysis, on the other hand, maps the routes people take, helping you determine whether your layout effectively guides them or unintentionally creates underutilized spaces.
"Heat Map is an amazing feature that can quantify something that up until now can only be determined by gut feel through direct observation." – Montavue
This technology also enables layout-level A/B testing. By comparing heatmaps before and after making changes to a space, you can evaluate the actual impact of those adjustments, moving beyond anecdotal feedback to data-driven decisions.
These insights don’t just refine strategies – they also open the door to measurable cost savings.
Cost Savings and Efficiency Gains
The efficiency gains from heatmap analytics often surface in unexpected areas. For example, in warehousing and logistics, tracking the movement of pickers and forklifts can highlight idle zones, reducing travel time and speeding up order fulfilment. In office environments, space utilization data can identify underused meeting rooms, enabling facilities teams to repurpose or downsize spaces rather than paying to maintain them unnecessarily.
The results can be impressive. For instance, a global consumer healthcare company used heatmap optimization to enhance product placement and packaging visibility, achieving 7% growth in toothpaste sales. This kind of data-driven success is why more businesses across retail, manufacturing, and public sectors in Canada are adopting these tools.
Beyond immediate savings, the continuous data collection offered by these systems supports long-term growth and scalability.
Automated, Scalable Data Collection
One of the most practical benefits of computer vision heatmaps is their ability to operate continuously without requiring human oversight. These systems collect and process data automatically, generating detailed reports on a weekly, monthly, or yearly basis. Such long-term trend analysis would be nearly impossible to achieve manually.
As your business grows, these systems can scale effortlessly. Modern edge-to-cloud setups allow for real-time, on-site data processing while maintaining centralized reporting across multiple locations. Whether you’re overseeing a single store or a network of facilities across provinces, the data pipeline remains efficient and manageable, without adding unnecessary complexity to your operations.
Conclusion: Making the Case for Computer Vision in Heatmap Analytics
This guide highlights how computer vision reshapes heatmap analytics, moving far beyond simple click tracking or foot traffic counts. It takes physical movements – whether it’s a shopper navigating a store, a forklift in action, or staff performing tasks – and turns them into detailed, actionable data.
The momentum for adopting this technology is growing across Canada. By early 2025, 42% of Canadian IT decision-makers reported seeing a positive return on investment (ROI) from AI initiatives, with 56% planning to increase spending within the year. The computer vision market in Canada is also expected to grow at an annual rate of 32.3% between 2025 and 2030, indicating that this technology is quickly becoming a standard tool.
What makes computer vision particularly appealing is its scalability. Whether you’re focusing on a single retail store or managing operations across several provinces, these systems can adapt and improve over time. As Maribel Lopez from Lopez Research explains:
"As organizations begin to implement AI at scale, many are placing greater stock in success metrics such as productivity gains, in part because traditional hard-dollar ROI have yet to show up on the balance sheets." To help quantify these gains, businesses can use a workflow automation savings estimator to project potential financial impacts.
This perspective is crucial for Canadian businesses deciding where to begin. The benefits of computer vision-powered heatmaps grow over time, enabling better layouts, smarter staffing, streamlined workflows, and more precise decision-making. For companies that depend on understanding how spaces are used, this technology delivers a clear, data-driven edge – making now the time to act.
FAQs
What camera setup works best for accurate heatmaps?
To create precise heatmaps, start with high-resolution cameras placed in strategic locations to fully cover the target area. Ensure the footage is clear and stable, as blurry or shaky recordings can compromise the data. Adding proper lighting and capturing from multiple angles can significantly boost detection accuracy, resulting in more reliable and detailed data.
How do you avoid counting the same person twice?
Computer vision systems help eliminate double counting in heatmap analytics by following individual movement patterns over time. This allows the system to identify each person uniquely, ensuring they are counted only once – even in crowded spaces.
What privacy rules apply when using video-based heatmaps in Canada?
In Canada, privacy laws mandate obtaining valid consent before collecting, using, or sharing video-based heatmap data. This becomes even more critical when the data involves demographics or biometrics, as regulators have expressed concerns about whether such practices are proportional and acceptable to society. To respect individuals’ rights, it’s essential to ensure full compliance with privacy standards.