
AI Success Metrics: What to Measure and How to Track It

The best AI success metrics are the ones tied to a business result you already measure: hours per transaction, error and rework rates, cost per shipment, revenue per account. Model accuracy and latency matter, but only as supporting evidence. Pick a handful of metrics across business impact, operations, adoption and technical performance, record a baseline before you build anything, and review them on a fixed schedule.
This guide is for operators and executives who have to justify an AI project to a board, a CFO or their own team. It covers the metric layers, how to choose for your use case, how to calculate return on AI investment, and the mistakes that make results look better or worse than they are.
TL;DR
- Measure AI on four layers: business impact, operational efficiency, adoption, and technical performance. A model can score well on the last and still fail on the first.
- Metrics describe what happens. KPIs are the few metrics tied to a business objective with a target.
- Set the baseline and the success criteria before the project starts, not after the first demo.
- Calculate ROI as net benefit divided by total cost of ownership, and count the indirect costs: data preparation, integration, training and monitoring.
- Keep the scorecard small. Five to eight indicators that someone owns beat forty that nobody reads.
Table of Contents
- AI metrics and AI KPIs: the difference that matters
- The four layers of AI success metrics
- Choosing metrics for your use case
- Set the baseline before you build
- How to calculate return on AI investment
- Leading and lagging indicators over time
- Mistakes that make AI results misleading
- Our perspective
- Put a scorecard in place with our help
- FAQ
- Sources
AI metrics and AI KPIs: the difference that matters
People use the two terms interchangeably, and that causes muddled dashboards. One industry explainer puts it simply: metrics describe what a business is doing, while KPIs show how it is doing against business objectives. Latency, user counts and accuracy are metrics. A KPI is the subset you commit to, with a target and an owner.
Take accuracy. Digital Health Canada’s KPI Library defines it as the proportion of AI outputs that are correct against a reference standard, and error rate as how often outputs are wrong. Those are legitimate indicators. But for a logistics dispatcher, “the model is 94% accurate” only becomes a KPI when you translate it: “misrouted loads fall from X to Y per month.”
A useful test for any metric: if it moved by 20%, would someone change a decision? If not, it belongs in a technical log, not on the executive scorecard.
The four layers of AI success metrics
Most ranking guides organize metrics in groups, and the groupings overlap heavily. The Corporate Finance Institute sorts AI KPIs into efficiency, effectiveness, business impact, and fairness and compliance. Digital Health Canada separates technical and model-performance measures from implementation, user-experience, operational and financial ones. Here is a practical version that works for non-clinical businesses.
| Layer | Question it answers | Example metrics |
|---|---|---|
| Business impact | Did the business get better? | Cost per transaction, revenue per customer, margin, cash tied up in rework |
| Operational efficiency | Is the work faster and cleaner? | Hours per task, cycle time, error rate, rework volume, throughput |
| Adoption and workflow fit | Do people actually use it? | Active users, frequency of use, share of tasks run through the tool, overrides |
| Technical performance | Does the system behave? | Accuracy, recall, latency, uptime, drift |
Business impact
This is the layer your board cares about, and the hardest to attribute. Choose one or two financial outcomes the project is supposed to move, such as cost per shipment or days to invoice. Express them in dollars or in a unit that converts cleanly to dollars.
Operational efficiency
APQC recommends consistent units of work, such as hours per transaction or completed units per employee, paired with quality measures like error rates and rework volume. The pairing is the point. A tool that doubles speed while doubling rework has not improved productivity.
Adoption and workflow fit
A tool nobody opens produces no return. For generative AI used by employees, Google Cloud points to adoption rate, frequency of use, session length and user feedback such as thumbs up and down. Add one measure of workflow fit that is specific to you: how often staff override or redo the AI’s output.
Technical performance
Keep it, but keep it in its place. Google Cloud’s architecture guidance distinguishes quality from performance and notes that the highest-performing model might not lead to the best business outcome. Technical metrics tell you why a result moved. They do not tell you whether it was worth it.
Choosing metrics for your use case
The right set depends on what the system does and what a mistake costs. Three common cases:
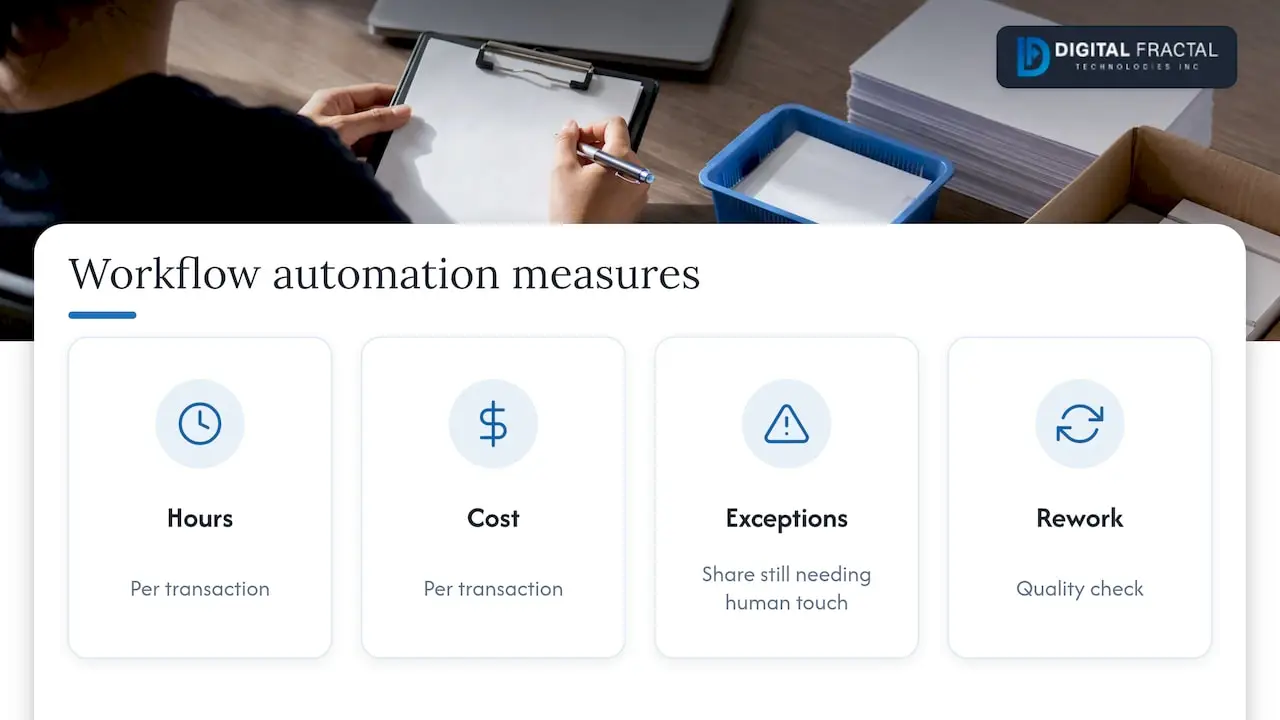
Workflow automation (invoicing, intake, scheduling). Lead with hours per transaction, cost per transaction and exception rate (the share of items a person still has to touch). Add rework volume as the quality check. Technical metrics are secondary because the process outcome is directly countable.
Logistics and field operations. Real-time insight is the product, so measure the decisions it changes: time from exception to response, late or misrouted loads, idle asset time, manual status calls avoided. For any prediction model, choose the error type that hurts. In supervised fraud detection, Google Cloud notes that recall is often more relevant at inference time than the loss function used in training. The same logic applies to predictive maintenance: a missed failure costs far more than an unnecessary inspection, so track missed-event rate and false-alarm rate separately.
Knowledge work (assistants, chatbots, document search). Output counts are not enough. APQC’s research suggests productivity measures for knowledge-intensive work should also cover workflow, information access and collaboration. Time to find an answer and first-contact resolution tell you more than messages processed. Agency-side write-ups such as this look at AI productivity gains for agencies show the same split between early signals and later financial results.
Whatever the case, resist the urge to measure everything. Digital Health Canada’s 2026 toolkit advises prioritizing a small number of meaningful indicators that generate actionable insight over comprehensive measurement. That advice was written for healthcare, and it holds in any sector.
For sector-specific numbers, see our AI ROI metrics by industry page.
Set the baseline before you build
The most common reason an AI project cannot prove its value is that nobody recorded how the process performed before. Scale AI Canada says success criteria should be defined before the project begins, and frames measurement around whether the intended objectives were achieved.
The Government of Canada’s AI Readiness Scorecard, from the Canada School of Public Service, is a good checklist of what to capture first. It asks about resource impacts such as time and money, how often the process leads to errors or rework, and whether the process is stable with desired outcomes that are clear and agreed. Turn that into a one-page baseline:
- Name the process and its owner. One process, one accountable person.
- Record current volume and time. Transactions per month, hours spent, people involved. Use two or three months of data, not a guess.
- Record quality. Error rate, rework volume, complaints, exceptions.
- Record cost. Loaded labour cost per hour, plus any external fees the process triggers.
- Agree the target and the date. For example, a 30% cut in hours per transaction within the first quarter after go-live. Write it down and get sign-off from finance.
- Decide how you will attribute change. Run the old and new process side by side on a sample, or compare against a similar team or site that has not changed.
If the process is unstable or its outcome is disputed, fix that first. Our AI readiness checklist covers the other prerequisites, and enterprise data readiness explains why the data behind your baseline matters.
How to calculate return on AI investment
The simplest formula is the one finance already understands. Shopify’s enterprise guide gives AI ROI as net benefit divided by total cost of ownership, multiplied by 100. Its cost list includes licenses, implementation, internal labour, quality assurance, governance and ongoing monitoring, and it names data preparation, integration and training as indirect costs. It also separates financial, operational and risk returns.
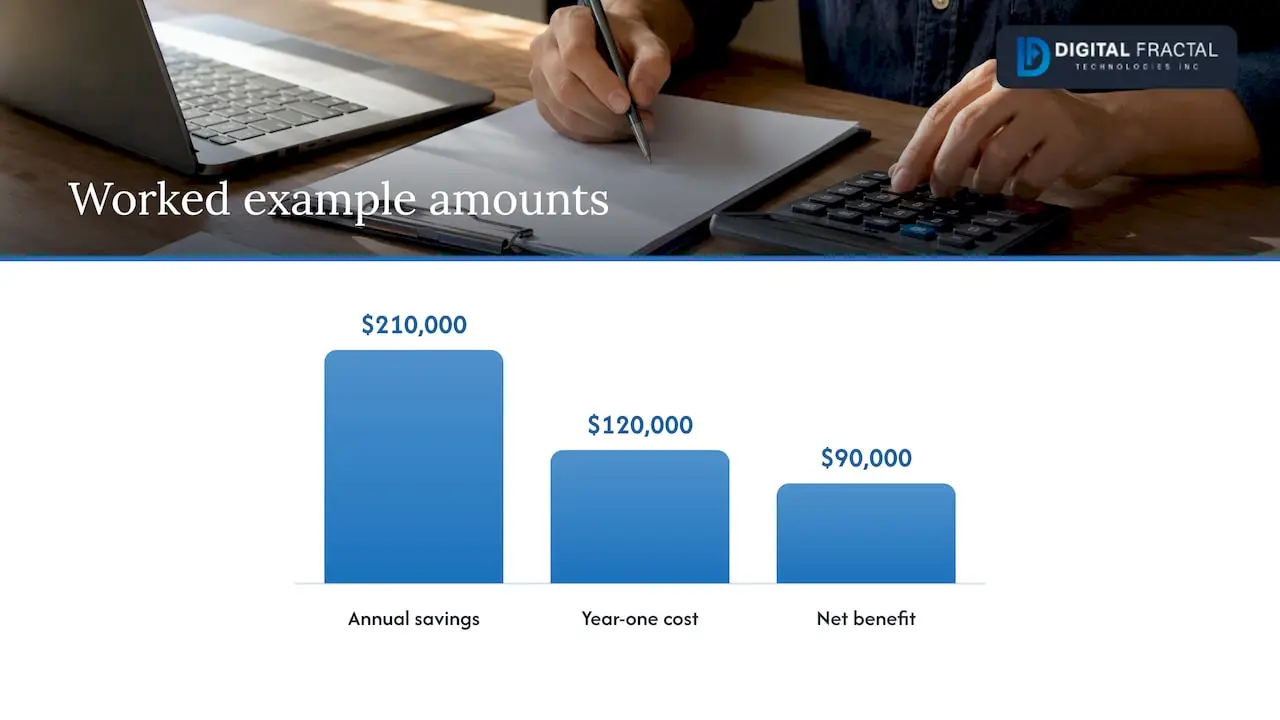
A worked example
The numbers below are hypothetical, to show the arithmetic. A regional carrier automates load-confirmation paperwork.
| Item | Amount |
|---|---|
| Hours saved per year (4,200 hours at a loaded $50 per hour) | $210,000 |
| Total cost of ownership, year one (build, integration, data cleanup, training, monitoring, internal staff time) | $120,000 |
| Net benefit ($210,000 minus $120,000) | $90,000 |
| ROI ($90,000 ÷ $120,000 × 100) | 75% |
Three habits keep a calculation like this honest. Count internal staff time on the cost side, because it is real even when no invoice exists. Count only hours that were redeployed or removed, not hours that vanished into a longer coffee break. And show year one and year two separately, since build costs fall away while monitoring continues.
Timing matters too. Industry blogs often quote payback windows for AI projects, but treat any such number as a rough range and not a promise. Your own baseline, scope and data quality decide the real figure. For budgeting inputs, see our AI implementation cost guide, and if you are building the case for directors, the AI business case for boards is written for that audience. To get a first estimate for automation, try the workflow automation savings calculator.
Leading and lagging indicators over time
Revenue and cost reductions show up late. Waiting for them means a project can drift for two quarters before anyone knows if it works. Mercor distinguishes leading indicators, such as adoption and review quality, from lagging ones such as revenue impact and cost reduction. Track both, and read them together: rising adoption with flat results means the tool is used but not useful, while strong results with low adoption usually means a few power users are carrying it.
For a staged review rhythm, borrow the structure Digital Health Canada recommends for clinical AI: pre-implementation readiness, early-stage evaluation, a scale decision, and ongoing sustainment. In a business setting that becomes:
- Before launch: baseline and targets signed off.
- First 30 to 60 days: adoption, error rate, exception rate and user feedback.
- At the scale decision: operational results against target, with a first ROI estimate.
- Ongoing: monitoring for drift, cost of ownership, and quarterly ROI.
Researchers at IMD argue that AI success is rooted in a clear theory of value: you should be able to say which operational lever moves which value driver. If you cannot draw that line on a whiteboard, no metric will rescue the project.
Mistakes that make AI results misleading
- Vanity metrics. IMD lists tracking measures that are not linked to business outcomes, using incoherent metrics, and scaling isolated pilots instead of building a coherent portfolio among the common mistakes. Prompts sent or documents processed look impressive and prove nothing.
- Equating usage with value. APQC advises a layered scorecard so that usage statistics are not mistaken for business value.
- Measuring speed without quality. Faster output with more rework is a loss. Always pair a speed metric with an error or rework metric.
- Leaving costs out. Data preparation, integration and monitoring are easy to forget and can be a large share of the total.
- No baseline. Without one, every improvement is an anecdote.
- Declaring victory on a pilot. A pilot with hand-picked data and enthusiastic users overstates what a full rollout will deliver.
Our perspective
Most of the AI projects we are asked to rescue did not fail technically. They failed because nobody agreed on what “working” meant. The demo was impressive, the model was accurate, and six months later no one could say whether the business was better off.
So we start every engagement with the measurement question, not the model question. In the AI Readiness Audit we look at the process first: how long it takes, where errors and rework occur, who touches it. That gives us a baseline and a short list of automation candidates ranked by measurable impact. We favour tailored systems built around your workflows and systems over generic tooling, because the metrics only mean something when the solution is fitted to the process being measured.
Our rule of thumb is one business outcome, two or three operational measures, one adoption measure and a technical check, all reviewed on a 90-day horizon. If a project cannot show movement on its operational measures in that window, we want to know early and adjust, not discover it at year-end.
— Souhail
Put a scorecard in place with our help
If you want the baseline and scorecard built for you, our AI Readiness Audit is a one-off engagement priced from $2,500 to $10,000 depending on scope. It identifies where AI and automation can pay off in your operations, whether in logistics, construction or another sector, and defines how each opportunity will be measured. If your priority is a specific process, our workflow automation service applies the same approach to implementation.
FAQ
How do you measure AI success?
Pick one business outcome, two or three operational measures and an adoption measure, then add technical metrics that explain the results. Record a baseline before launch and compare against it at fixed intervals. Success means the outcome moved against a target you agreed in advance.
What is the difference between AI KPIs and AI performance metrics?
Performance metrics describe how the system behaves, such as accuracy, error rate and latency. KPIs are the few measures tied to a business objective, with targets and owners. Many KPIs are built from performance metrics translated into business terms.
How do I calculate return on AI investment?
Divide net benefit by total cost of ownership and multiply by 100. Include licences, implementation, internal labour, data preparation, integration, training and monitoring on the cost side. Benefits can be financial, operational or risk-related, but convert them to dollars where you can.
How many metrics should we track?
Fewer than you think. Five to eight indicators across the four layers is enough for most projects. Each should have an owner and a decision it could change.
Sources
- Google Cloud: AI and ML perspective, performance optimization
- Google Cloud: KPIs for gen AI
- Digital Health Canada: KPI Library
- Digital Health Canada: Clinical AI Toolkit
- Corporate Finance Institute: AI KPIs
- TechTarget: Top AI KPIs that business leaders need to know
- APQC: How can AI value, ROI and productivity impact be measured?
- Canada School of Public Service: AI Readiness Scorecard
- Scale AI Canada: Measure What Matters
- Shopify: How to calculate ROI for AI investments
- Mercor: AI performance metrics and KPIs
- IMD: From hype to ROI
- AI productivity gains for agencies