10–20 Asset Pilot: Predictive Maintenance with XAI for Contractors

Predictive maintenance uses sensors and AI to catch equipment failures weeks before they force a shutdown, and it commonly cuts unplanned failures by 30 to 50 percent for fleets that adopt it. The payoff starts small, on a handful of machines, not across an entire fleet on day one. Contractors who see real returns almost always start with a pilot of ten to twenty assets rather than a fleet-wide rollout.
TL;DR:
- Hydraulic systems on excavators and loaders deliver the fastest cost savings, especially when oil analysis sensors are used to catch early failures.
- Successful pilots typically involve 10 to 20 critical assets, run for at least six months, and validate model accuracy before full fleet expansion.
- Sensor hardware costs depend on asset criticality, with vibration, oil, temperature, and current sensors prioritized on key rotating equipment.
- A comprehensive predictive maintenance program requires clear integration workflows, ongoing technician training, and data security measures to ensure adoption.
Table of Contents
- What Is Predictive Maintenance for Construction Equipment?
- What ROI Can Contractors Expect from Predictive Maintenance?
- How Predictive Maintenance Actually Works on a Jobsite
- Building a Pilot-First Rollout: From Selection to Fleet-Wide Scale
- Which Assets and Sensors Should You Prioritize First?
- Why Maintenance History and Explainability Matter for Model Accuracy
- Connecting PdM Alerts to Work Orders and Parts Procurement
- Pitfalls to Avoid and KPIs That Prove the Program Works
- Data Security and Privacy in Connected Equipment Programs
- Real-World Examples of Predictive Maintenance Paying Off
- What a Predictive Maintenance Budget Actually Includes
- A Pilot-First Path That Actually Gets Adopted
- How Contractors Move from Pilot to Payback
- Sources
What Is Predictive Maintenance for Construction Equipment?
Predictive maintenance (PdM) uses sensor data and machine learning to estimate when a specific machine component will fail, so a crew replaces it before it breaks down mid-job. That’s different from reactive maintenance, where you fix things after they fail, and different again from preventive maintenance, where you service parts on a fixed calendar whether they need it or not. A hydraulic pump serviced every 500 hours under a preventive schedule might fail at hour 420 or run fine to hour 800. Predictive maintenance watches the actual condition of that pump and tells you which.
Analytics maturity in this space runs across five rough levels:
- Threshold alerts flag a reading outside a fixed range, like oil temperature above 220°F.
- Trend analysis tracks how a value moves over time, catching slow drift before it crosses a threshold.
- Anomaly detection flags patterns that don’t match a machine’s normal operating signature, even without a preset limit.
- Remaining useful life (RUL) modeling estimates how many operating hours or cycles remain before a part likely fails.
- Prescriptive analytics goes one step further, recommending the specific action, part, and timing to fix it.
Most construction fleets start at threshold alerts and work toward RUL modeling as data accumulates. Skipping straight to prescriptive analytics without a data history usually produces unreliable recommendations.
What ROI Can Contractors Expect from Predictive Maintenance?
The numbers vary by fleet size and asset mix, but the pattern across industry case reports is consistent enough to plan around.
By the numbers: PdM deployments in construction commonly reduce unplanned failures by 30 to 50 percent, cut total downtime by 25 to 40 percent, and lower maintenance costs by roughly 20 to 30 percent.
Those figures cover direct maintenance spend. The indirect gains often matter more to a project manager: fewer schedule slips because a critical excavator didn’t go down mid-pour, less emergency equipment rental to cover a broken machine, and more predictable crew scheduling because you know a loader is coming offline for two hours next Tuesday instead of finding out at 6 a.m. on a Friday.
Timelines matter here too. Most contractors see first measurable returns within six to twelve months, with full program payback landing between twelve and eighteen months. That gap between “first win” and “full ROI” trips up a lot of pilots that get judged too early.
- Emergency repair spend typically drops first, often within the first quarter of stable sensor data.
- Equipment availability improvements show up next, as fewer machines sit in the shop waiting on diagnosis.
- Extended component life is usually the last benefit to show clearly in the numbers, since it takes a full service cycle or two to confirm.
How Predictive Maintenance Actually Works on a Jobsite
The technology stack sounds complicated until you break it into four layers: sensing, transmission, processing, and output. Each layer does one job, and each maps to specific failure modes you already know your equipment has.
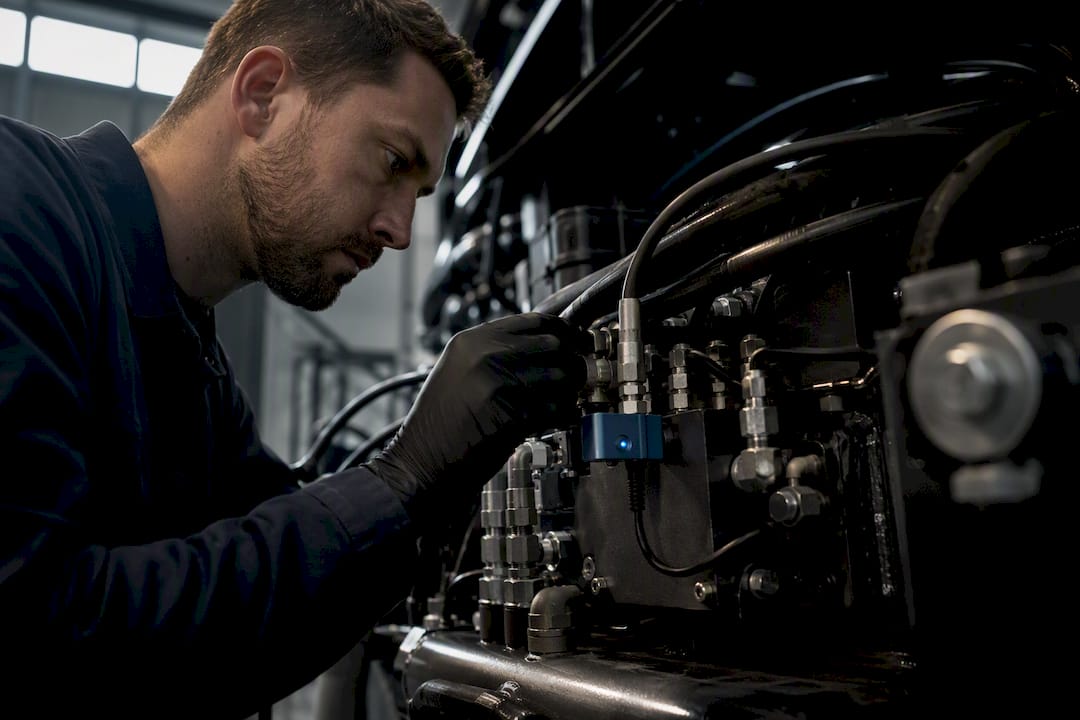
Sensors do the listening. Vibration sensors on rotating components like bearings, gearboxes, and pumps pick up the earliest signs of mechanical wear, and vibration analysis remains the most mature PdM technique for that category of failure. Oil analysis sensors track particle counts and viscosity changes in hydraulic systems, which is where a huge share of excavator and loader downtime originates. Temperature sensors catch electrical faults and overheating bearings. Current sensors on motors detect load imbalances before they burn out a winding. GPS and telematics units, the kind partners like Moto Watchdog provide for fleet tracking, add location and utilization context that helps correlate failures with specific job conditions.
Data moves through edge processing or cloud processing, often both. Edge devices filter noise and flag obvious anomalies right at the machine, which matters on remote jobsites with spotty connectivity. The filtered data then syncs to a cloud platform when a signal is available, where heavier models run.
| Analytics method | Best for | Main limitation |
|---|---|---|
| Anomaly detection | Catching unknown or novel failure patterns | Higher false-positive rate early on |
| Supervised classification | Identifying known failure types with labeled history | Needs substantial historical failure data |
| RUL estimation | Scheduling replacement before failure | Requires 3 to 6 months of baseline data |
Anomaly detection is usually the first model type deployed because it doesn’t require labeled failure history. Supervised classification and RUL models come later, once you’ve logged enough real failures and near-failures to train them properly.
Building a Pilot-First Rollout: From Selection to Fleet-Wide Scale
Skip the fleet-wide sensor blitz. A structured pilot on a limited set of assets is how contractors actually validate whether predictive maintenance construction programs pay off before committing real budget.
- Select 10 to 20 pilot assets. Mix critical-path machines (the excavator that, if down, stops the whole crew) with a few lower-stakes units for comparison. Weight the selection using a simple criticality score: downtime cost per hour times likelihood of failure.
- Install sensors and connect telematics. Budget four to eight weeks for hardware installation and initial signal-quality checks, per common industry timelines.
- Collect baseline data. Run for three to six months minimum before trusting any model output, especially for vibration-based RUL predictions.
- Validate against real events. Compare model flags to actual maintenance events and technician logs to check accuracy.
- Integrate alerts into existing workflows. Route validated alerts into your CMMS or ERP system so they generate real work orders.
- Scale to the broader fleet. Expand only after the pilot clears defined accuracy and false-positive thresholds.
Pro Tip: Don’t judge a pilot’s success at the three-month mark. That’s usually still baseline collection, not proof of anything. Set your evaluation checkpoint at month six, when the model has enough seasonal and usage variation to be trustworthy.
Moving from pilot to full rollout should hinge on hard validation rules, not enthusiasm. If the pilot’s false-positive rate stays under a set threshold and predicted failures match a meaningful share of actual events, expand. If not, extend the baseline period rather than scaling a shaky model across forty machines.
Which Assets and Sensors Should You Prioritize First?
Not every machine deserves the same sensor investment. Prioritize equipment on the critical path, the stuff that stops a whole crew when it goes down, over backup or low-utilization units sitting in the yard.
- Rotating equipment (pumps, compressors, generators) gets vibration sensors first, since they cover a large share of mechanical failure signatures.
- Hydraulic systems on excavators and loaders benefit most from oil analysis, catching contamination and wear before a hose or seal fails.
- Electrical systems and motors need temperature and current monitoring to catch overheating before a winding burns out.
- Retrofit sensor kits typically run a few hundred to a couple thousand dollars per asset depending on sensor count and connectivity.
- OEM telematics already installed on newer machines often cover GPS, engine hours, and basic fault codes, which may be enough for lower-priority assets without additional retrofit spend.
Reserve retrofit sensor budgets for the assets where downtime actually hurts the schedule.
Why Maintenance History and Explainability Matter for Model Accuracy
Sensor data alone tells an incomplete story. A vibration spike means something different on a pump that’s six months past its last seal replacement versus one that was just rebuilt. Feeding maintenance logs and parts history into the model alongside live sensor streams measurably improves prediction quality, because the model learns the actual failure context, not just the raw signal.
Hybrid architectures tend to perform best here. Combining a temporal model like an LSTM, which handles time-series sensor patterns well, with an ensemble classifier like XGBoost, which handles structured maintenance records, gives you a model that reads both the vibration trend and the service history at once.
- Time-series models (LSTM, Bi-LSTM) handle continuous sensor streams.
- Ensemble classifiers (XGBoost, random forests) handle structured maintenance and parts data.
-S HAP or LIME explainability layers show technicians which specific signals drove an alert.
Pro Tip: If your maintenance team keeps overriding PdM alerts, the problem usually isn’t the model. It’s trust. Add an explainability layer that shows the top three signals behind each alert, and override rates tend to drop fast once technicians can see the reasoning.
Explainable AI (XAI) isn’t a nice add-on here. Technicians who can see which vibration frequency or oil particle count drove a flagged alert are far more likely to act on it than one delivered as an unexplained red light.

Connecting PdM Alerts to Work Orders and Parts Procurement
An alert that nobody acts on is worthless. The real value of predictive maintenance construction programs shows up when alerts flow directly into your existing maintenance workflow instead of sitting in a dashboard someone checks once a week.
- Auto-generate work orders in your CMMS or ERP the moment a validated alert crosses threshold, tagged with priority and asset ID.
- Trigger parts requisitions automatically for common failure components, so the part is ordered before the technician even gets the ticket. A CMMS platform built for this kind of automation removes the manual lag entirely.
- Set human approval checkpoints for high-cost repairs or ambiguous alerts, keeping a supervisor in the loop before major spend gets authorized.
- Build an escalation matrix so unresolved alerts route up automatically after a set time window.
Training matters as much as the software configuration. Technicians need a clear procedure for what to do when an alert fires, not just access to a new screen.
Pitfalls to Avoid and KPIs That Prove the Program Works
The most common mistake is rushing the baseline. Trusting model output before three to six months of clean data leads to noisy predictions and technicians who stop trusting the system fast. A second common failure: alerts get generated but nobody owns acting on them, so they pile up unresolved. A third: spare parts procurement doesn’t get updated to match the new alert cadence, so a validated prediction still results in a two-week wait for a part.
Track these KPIs to know if the program is actually working:
- Mean time between failures (MTBF), which should rise as the program matures.
- RUL prediction accuracy, comparing predicted versus actual failure timing.
- Emergency repair reduction, the clearest early signal of value.
- Equipment availability, the percentage of scheduled uptime actually delivered.
Expect a higher false-positive rate in the first few months. Tune thresholds gradually rather than abandoning a model after one bad call.
Data Security and Privacy in Connected Equipment Programs
Every sensor and telematics unit on a jobsite is a data collection point, and that data usually travels through a cloud platform before it reaches anyone’s dashboard. That raises real questions about who owns the data, where it’s stored, and who can access it.
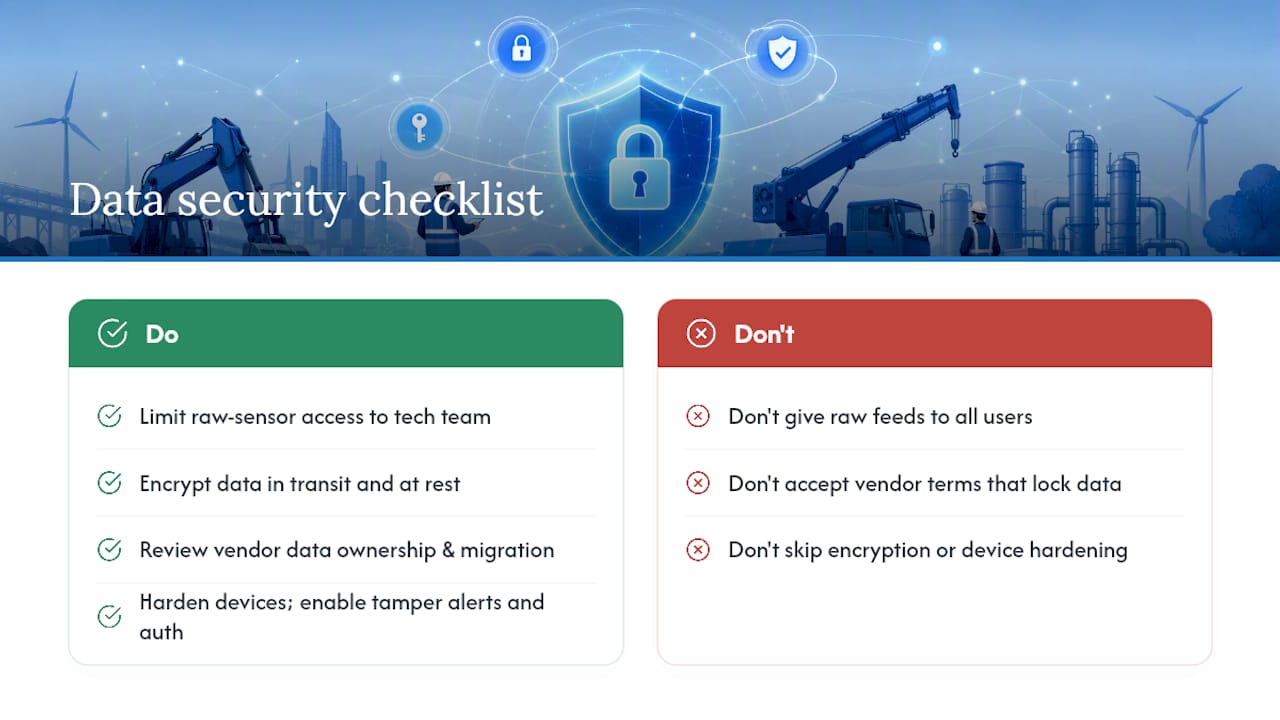
Start with access control. Not every stakeholder needs raw sensor feeds; most need summarized alerts and reports. Limiting raw data access to a small technical team reduces the attack surface significantly.
Encryption matters at two points: while data moves from the machine to the cloud, and while it sits in storage. A telematics unit transmitting over an unsecured connection is an easy entry point for interception, especially on remote sites without hardened network infrastructure.
Vendor contracts deserve scrutiny too. Ask directly who owns the historical maintenance and sensor data your fleet generates, whether the vendor can use it for other purposes, and what happens to that data if you switch providers. Some cloud PdM platforms bundle data ownership terms in ways that make it hard to migrate later.
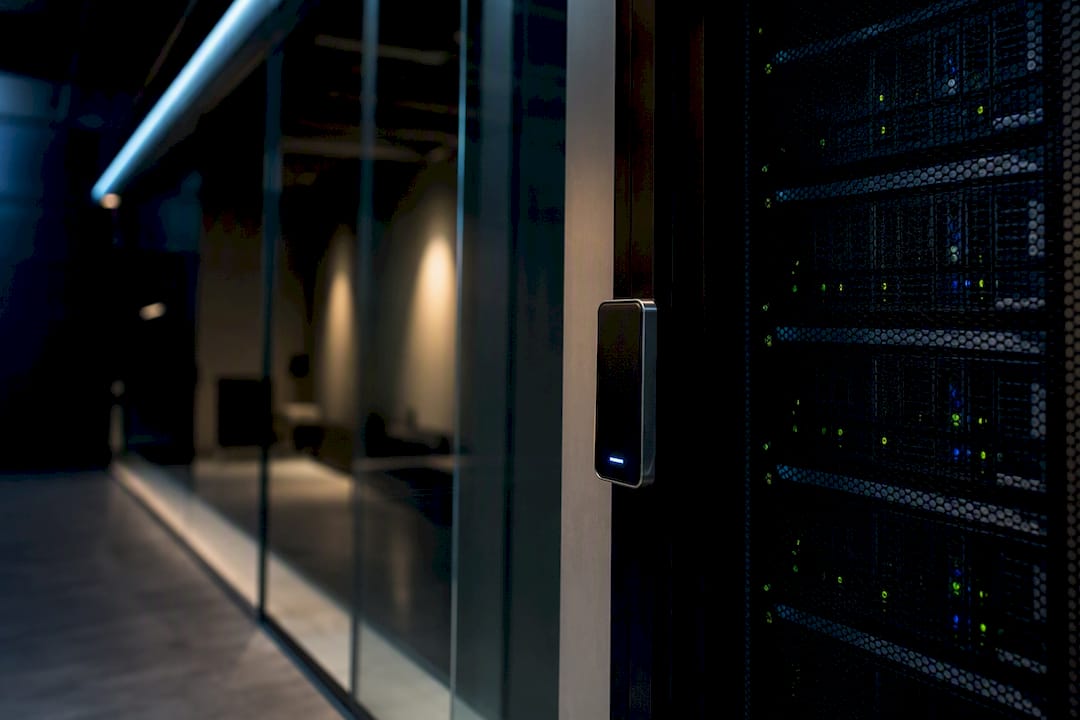
Physical security counts as well. A sensor or gateway device sitting exposed on equipment can be tampered with or stolen, disrupting the data pipeline. Basic physical hardening, tamper alerts, and device authentication reduce that risk without adding much cost.
None of this is exotic. It’s the same due diligence any construction firm already applies to financial software, applied to the sensor network now living on its equipment.
Real-World Examples of Predictive Maintenance Paying Off
The clearest pattern across implementation case reports is that success correlates with narrow, disciplined pilots rather than ambitious fleet-wide launches. Contractors who instrumented a small set of high-criticality machines, let the baseline run its full course, and only then expanded, consistently reported the downtime and cost reductions that vendor materials promise.
One recurring theme in these reports: hydraulic system monitoring on excavators and loaders tends to deliver the fastest visible win, because hydraulic failures are common, expensive, and detectable early through oil analysis. Fleets that started there, rather than with electrical systems or GPS-only telematics, tended to show measurable cost savings within the first two quarters.
Another pattern worth noting: contractors that combined sensor data with existing maintenance records from day one reached usable model accuracy faster than those that relied on sensor data alone. That echoes the broader finding that hybrid models combining time-series data with historical service records outperform sensor-only approaches.
The failure pattern is just as instructive. Programs that instrumented too many assets at once, without a clear criticality ranking, tended to drown in data without a clear plan for acting on it. Alerts piled up, nobody owned response, and the pilot got quietly abandoned before it had a chance to prove anything. Scope discipline, more than sensor quality, seems to separate the programs that stick from the ones that don’t.
What a Predictive Maintenance Budget Actually Includes
Four cost categories make up most PdM budgets: hardware, software and platform fees, integration work, and training.
Hardware covers the sensors themselves, vibration, temperature, oil, and current sensors, plus any gateway or edge processing devices needed to transmit data from remote jobsites. Retrofit costs scale with sensor count and connectivity requirements; OEM-equipped newer machines need less additional hardware than an older fleet.
Software and platform costs cover the cloud analytics platform, data storage, and any per-asset or per-sensor licensing fees the vendor charges. This is often billed as a recurring subscription rather than a one-time purchase, so budget for it as an ongoing operating cost, not a capital expense.
Integration work covers connecting the PdM platform to your existing CMMS or ERP system so alerts become work orders automatically. This is frequently underbudgeted. A platform that generates great predictions but dumps them into an email inbox nobody checks delivers a fraction of its potential value.
Training rounds out the budget. Technicians need to understand what an alert means, how to verify it, and when to escalate. Skipping this line item is one of the fastest ways to end up with a technically sound system that nobody actually uses.
Budget the pilot phase separately from the scale phase. A ten to twenty asset pilot costs meaningfully less than instrumenting an entire fleet, and treating it as a distinct line item makes the eventual scale-up decision a clean, data-backed choice rather than a sunk-cost gamble.
A Pilot-First Path That Actually Gets Adopted
The construction firms that get real value out of predictive maintenance treat it as a 90-day capability-building exercise, not a hardware purchase. A pilot-first approach, instrumenting a focused set of critical assets, collecting a real baseline, and validating before expanding, consistently outperforms the fleet-wide sensor rollout that looks impressive in a sales deck but generates more noise than usable signal in month one.
Vendor-led pilots move faster on installation but often leave a contractor dependent on that vendor’s platform and interpretation of the data. In-house pilots, or ones run alongside an implementation partner who hands off real capability, tend to produce a maintenance team that can actually interpret and act on alerts independently by month four. That difference shows up later, when the fleet scales past the pilot and someone needs to explain to a superintendent why a specific loader got flagged.
The technical wrapper here is standard, sensors, telematics, cloud analytics, but the outcome depends entirely on whether the team trusts and uses what the system tells them.
— Souhail
How Contractors Move from Pilot to Payback
Reading about vibration sensors and RUL models is one thing. Deciding which five machines to instrument first, which data you already have, and which gaps will stall your model is another. That’s the discovery work done before a single sensor goes on equipment.
The AI Readiness Audit is built for exactly this starting point. It maps your current fleet data, telematics coverage, and maintenance records against what a predictive maintenance program actually needs, then flags the gaps before you spend on sensors you don’t need yet. From there, a 90-day pilot blueprint outlines asset selection, sensor deployment, and CMMS integration on a fixed, contractor-friendly timeline rather than an open-ended engagement. If you’re weighing where to start, the AI integration consulting page walks through what a first engagement covers, and requesting a readiness audit is the direct next step toward a program built around your fleet, not a generic template.
Sources
- Predictive Maintenance Construction: Avoid Costly Breakdowns (2026) | AI Building Tools
- Predictive Maintenance Implementation Guide: From Sensors to Savings | ECOSIRE
- Hybrid Temporal Explainable Ensemble Network (HTEEN) for construction equipment failure prediction — JATIT