Data Drift Detection: Methods, Thresholds and a Monitoring Plan

Data drift detection means comparing the data your model sees in production against a reference sample, usually its training data, and raising an alert when the two differ by more than chance would explain. You do it with statistical tests on each input feature, a single stability score, or a classifier that tries to tell old rows from new ones. The harder part is deciding which alerts matter. A shift that changes nothing about your predictions should not trigger a retrain, and a quiet shift in the relationship between inputs and outcomes will not show up in input tests at all.
This guide covers the methods, the thresholds people start with, the traps that create false alarms, the difference between data drift and concept drift, and what Canadian organizations are expected to do about it.
TL;DR
- Data drift is a change in the input distribution. Concept drift is a change in the relationship between inputs and the outcome. They need different detection methods.
- Start with per-feature tests (Kolmogorov-Smirnov for continuous features, Population Stability Index as a summary score) on a fixed reference window, then tune thresholds to your own data.
- Exclude timestamps and running counters from tests, and separate harmless shifts from shifts that hurt performance, or you will retrain constantly for nothing.
- If you have no labels yet, monitor inputs and prediction distributions. When labels arrive, track real performance, which is the only direct test for concept drift.
- In Canada, federal guidance for automated decision systems expects regular performance evaluation, so drift monitoring is a governance task as well as an engineering one.
Table of Contents
- Data drift, concept drift and model drift: what each one means
- How data drift detection works
- Why most drift alerts are false alarms
- Detecting concept drift
- Drift is not always a reason to retrain
- Data quality comes first
- Why it is also a governance duty in Canada
- Why production monitoring is harder than the tutorials suggest
- A practical drift monitoring plan
- Our perspective
- Where an AI readiness audit fits
- FAQ
- Sources
Data drift, concept drift and model drift: what each one means
The three terms get used interchangeably, and that causes real confusion when you design alerts.
Data drift (also called covariate shift or distribution shift) is a statistical change in the inputs the model receives, written P(X). Concept drift is a change in the relationship between those inputs and the desired output, written P(y|X). In the second case the model’s learned mapping is no longer accurate even if the inputs look the same, as the Frouros documentation explains. Model drift is the umbrella term most teams use for the visible symptom: predictions get worse over time.
A logistics example makes the difference concrete. Say you predict delivery delays from route length, weather, depot load and time of day.
- Data drift: you add a new depot in a different region, and the mix of route lengths and weather conditions changes. The model has seen fewer of these inputs. Its rules may still hold, but it is working in thinner territory.
- Concept drift: a carrier changes its handoff rules, so the same route length and load now produce different delays. Inputs look familiar, yet the outcomes have moved.
- Both at once: common in practice, and the reason you want input monitoring and performance monitoring together.
The practical consequence: data drift can be detected without labels, because you only need the incoming inputs. Concept drift usually cannot be confirmed until you see the true outcomes, which in many businesses arrive days or months later.
How data drift detection works
Every approach follows the same pattern. You choose a reference distribution, you collect a current window of production data, and you measure the gap between them.
Statistical tests on individual features
The most common tools are hypothesis tests such as the Kolmogorov-Smirnov (KS) test and the Cramér-von Mises test, or distance measures such as Jensen-Shannon divergence. They quantify how far the production distribution sits from the baseline, often with a significance level like 0.05 to trigger an alert, as described in this model monitoring paper.
A rough guide to choosing:
| Feature type | Typical method | Notes |
|---|---|---|
| Continuous (weights, distances, durations) | KS test, Cramér-von Mises, Wasserstein distance | Sensitive to any change in distribution shape |
| Categorical (depot, product class, status) | Chi-squared test, Jensen-Shannon divergence | Watch for new categories that never appeared in training |
| Mixed or many features | Population Stability Index per feature, or a domain classifier | Gives one comparable score per feature |
| Text or images | Embedding distance, or a classifier on embeddings | Test the representation, not raw pixels or tokens |
Population Stability Index as a summary score
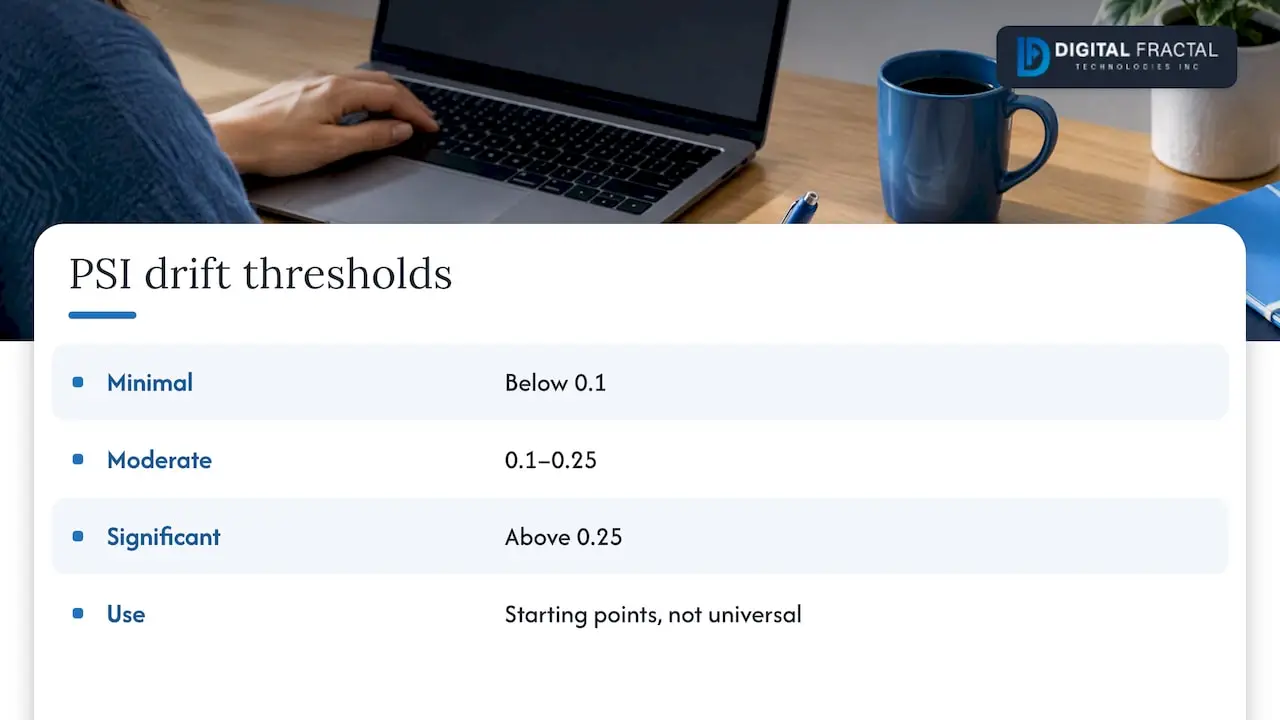
PSI bins a feature, compares the share of records in each bin between reference and production, and returns one number. A commonly cited rule of thumb treats PSI below 0.1 as minimal drift, 0.1 to 0.25 as moderate and worth investigating, and above 0.25 as significant. Treat these as starting points. They come from credit scoring practice and may be too loose or too tight for your data.
The classifier approach
Train a binary classifier to distinguish reference rows from production rows. If it can separate them well, something has shifted, and the model’s feature importances tell you where. This catches multivariate changes that single-feature tests miss, such as two features that individually look normal but no longer move together. The cost is that it needs more compute and more explanation to non-technical stakeholders.
Window design matters as much as the test
Two decisions shape your results more than the choice of test:
- Reference window. A fixed training snapshot tells you how far you have moved from what the model knows. A rolling window tells you about sudden change but hides slow creep.
- Current window size. Too small and tests are noisy. Too large and you detect problems weeks late. Many teams run two windows at once: a short one for fast alerts and a longer one for trend.
Why most drift alerts are false alarms
Teams that switch on drift monitoring for the first time often drown in alerts within a week. Three causes account for most of it.
Features that always drift
Raw timestamps, transaction counters and auto-incrementing IDs increase monotonically, so their distribution is always shifting. Including them in KS or distance-based tests produces automatic alerts regardless of model health. Practitioners exclude these features explicitly, as the same monitoring paper notes. Derive something stable instead, such as hour of day, day of week or time since last event.
Tests that are too sensitive
With large samples, a hypothesis test will flag tiny differences that have no effect on predictions. Research on this problem points out that standard shift tests are prone to false alarms and proposes detecting only adverse shifts, meaning those that actually degrade performance. The takeaway is to ask a different question. Not “has the distribution changed?” but “has it changed in a way that hurts?”
Expected seasonality
A courier network in Canada sees different volumes and weather in January than in July. If your reference window covers only summer, winter will look like drift every year. Build reference data that spans a full seasonal cycle, or compare against the same period last year.
Detecting concept drift
Because concept drift is about outcomes, the cleanest signal is performance on labelled data: accuracy, precision and recall, error rate, or business metrics like forecast error. Plan for three situations.
- Labels arrive quickly (for example, a delivery either arrived on time or did not by the next day). Track rolling performance metrics and alert on a sustained drop against a baseline.
- Labels arrive slowly (equipment failures, loan defaults). Monitor proxies in the meantime: the distribution of predictions, confidence scores, and the share of low-confidence cases. A sudden change in prediction mix without a change in inputs is a hint of concept drift.
- Labels arrive for a sample only. Pay for human review of a random slice each week. It is cheaper than it sounds and gives you an unbiased performance estimate.
Dedicated drift detectors that watch the model’s error stream exist as well, and they work well for streaming data. They still depend on having feedback, so no method removes the need for ground truth.
Drift is not always a reason to retrain
Detecting drift and acting on it are separate decisions. Experts recommend telling benign shifts from adverse ones with metrics tied to model performance, because tests of equal distributions often trigger costly, unnecessary retraining for minor changes (Kamulete, 2022).
A sensible response ladder looks like this:
- Log and watch. A single feature crosses a threshold, performance is flat. Note it and keep going.
- Investigate. Several features move, or a key feature moves. Check upstream: a sensor change, a schema change, a new customer segment, a bug in the pipeline.
- Adapt. Performance drops. Recalibrate, retrain on recent data, or add a lightweight local model on top of a stable global one. For fast operational settings, a layered design in which a static global model handles history and a small local model adapts to recent data can restore accuracy without full retraining.
- Rebuild. The problem itself has changed and the features no longer describe it. That is a new project, not a patch.
Many drift incidents turn out to be data pipeline faults, not changes in the world. A unit switched from kilometres to miles, a null filled with zero, a renamed field. This is why drift detection belongs next to data validation. If you have recently moved systems, our piece on data validation during cloud migration covers the checks that catch these faults early.
Data quality comes first
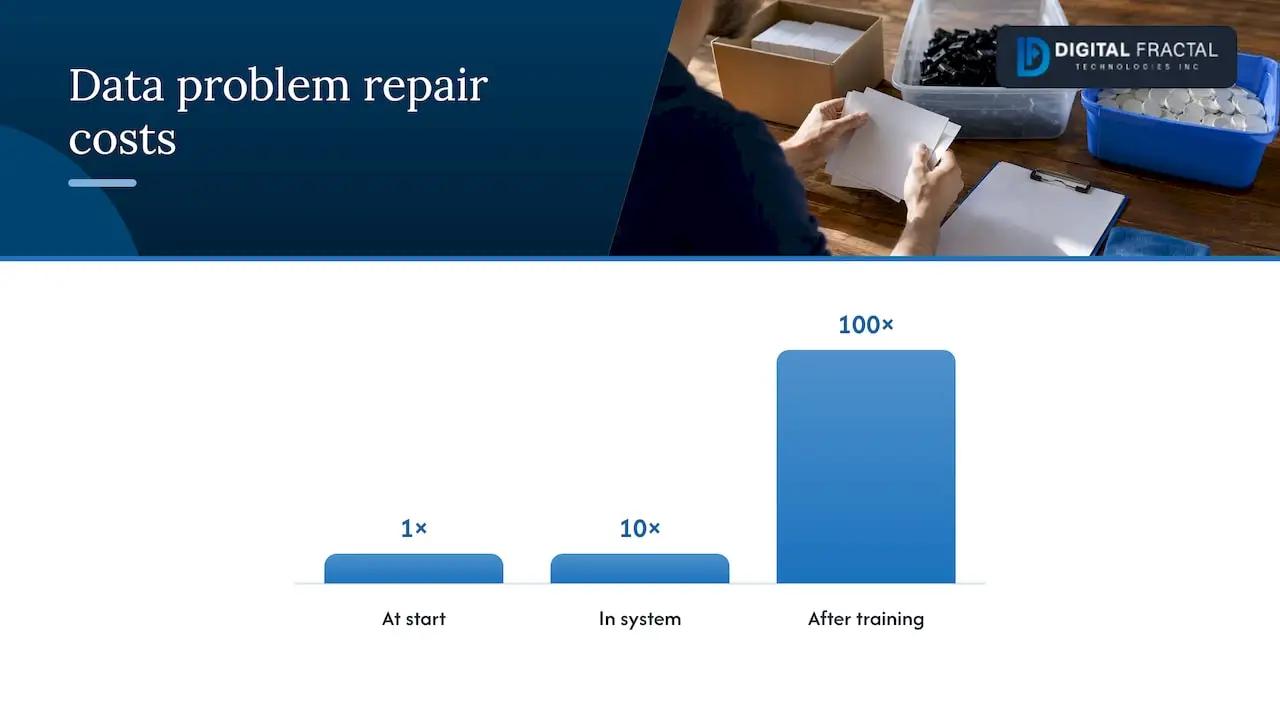
Drift monitoring only works if the reference data is sound. Cleaning duplicates, fixing mislabelled records and documenting how each field is collected gives you a baseline worth comparing against. Government guidance from Australia’s National AI Centre describes a 1-10-100 rule: fixing data problems costs roughly 1x at the start, 10x once they are in the system, and 100x once an AI system has been trained on bad data. Monitoring is the continuous part of that cost control.
A short data quality checklist to apply before you set drift baselines:
- Missing values: how many, and are they random or tied to a source?
- Duplicates and near-duplicates, especially after merging systems.
- Label quality: who labelled, with what guidelines, and how often do they disagree?
- Units, formats and time zones consistent across sources.
- Documented ownership of every input feed, so someone is accountable when it changes.
If you are unsure where you stand, our guide to enterprise data readiness walks through how to assess it.
Why it is also a governance duty in Canada
For organizations in Canada, drift monitoring is not only good engineering. The federal government’s Implementation Guide for managers of AI systems asks for regular performance evaluations to identify and address model drift, so systems do not produce unintended, unfair or harmful impacts. The guide is written for federal automated decision systems, but private-sector teams in regulated or public-facing work often use it as a reference for what good looks like. If you sell into government, you may be asked to show it.
The guide also stresses the human side. Managers should look beyond mathematical drift to harmful uses or impacts, and third-party feedback channels sit alongside automated statistical monitoring. In practice, that means a complaints route, a named owner who reviews drift reports, and a record of what was decided and why. Our AI audit trail guide and AI governance framework for Canadian businesses go deeper on documentation, and if personal information flows through your models, the PIPEDA checklist for AI is the place to start. This is general information, not legal advice. For a specific system, ask your privacy counsel or compliance lead which obligations apply.
Why production monitoring is harder than the tutorials suggest
The notebooks that rank for this topic usually run a test on two tidy dataframes. Production is messier. NIST’s report on monitoring deployed AI systems identifies fragmented logging across distributed infrastructure as a major barrier to centralized drift detection. It also finds that setting drift thresholds is an iterative process that needs domain knowledge, not a single mathematical formula.
For a logistics firm, that looks like telematics from one vendor, warehouse scans from another and a dispatch system that logs in a third format. Before any test runs, you need those inputs captured consistently with timestamps and model versions attached. Our write-up on ML observability for production pipelines shows what that plumbing looks like.
A practical drift monitoring plan
Here is a plan a small team can implement in a few weeks.
- Pick the model and its business metric. Name the decision it supports and the cost of being wrong.
- Freeze a reference dataset. Use training data or a clean production period covering a full seasonal cycle. Version it.
- Select features to monitor. Start with the top 10 to 20 by importance. Drop timestamps, IDs and counters.
- Choose a test per feature type. KS for continuous, chi-squared or Jensen-Shannon for categorical, PSI as the summary.
- Set initial thresholds, then tune. Begin with common rules like PSI of 0.1 and 0.25, run for a month in alert-only mode, and adjust to the volume your team can actually review.
- Monitor predictions and, when possible, performance. Track the prediction distribution daily and labelled accuracy as labels arrive.
- Define who acts and how. Write the response ladder above into a runbook with named owners.
- Review quarterly. Check thresholds, features, reference data and whether the model is still the right one.
Our perspective
We see the same pattern in projects: a model is built, performs well in testing, and then nobody owns it. Drift detection gets added late, as a dashboard, and it is ignored because it fires too often or says nothing about money.
Our approach is to start from the workflow, not the statistic. We ask what decision the model feeds, who relies on it, and what a wrong output costs in time or dollars. Only then do we pick the tests, and we tie thresholds to that cost. A drift alert that cannot be linked to a business consequence is noise.
We also push clients to treat monitoring as part of the build, not an add-on. If we are automating a workflow in logistics or construction, the logging, the reference dataset and the response runbook are scoped on day one. That is how we keep tailored solutions delivering value within a 90-day timeline instead of decaying quietly after launch.
— Souhail
Where an AI readiness audit fits
If you are running models without a drift plan, or planning your first one, the quickest way to see where you stand is our AI Readiness Audit. It reviews your data, systems and workflows and identifies where automation will pay off and what has to be in place to keep it working. The audit is a one-off engagement priced from $2,500 to $10,000. If you already know what you want built, see our AI and machine learning solutions for implementation work, or read the AI readiness checklist first.
FAQ
What is the difference between data drift and concept drift?
Data drift is a change in the distribution of model inputs. Concept drift is a change in how those inputs relate to the outcome you are predicting. You can spot data drift from inputs alone, while confirming concept drift generally requires labelled outcomes.
Which test should I use first?
For continuous features, the Kolmogorov-Smirnov test is a common starting point. For categorical features, use a chi-squared test or Jensen-Shannon divergence. Add PSI as a single comparable score across features, and tune thresholds on your own data rather than trusting defaults.
How often should I check for drift?
Match the cadence to how fast your data and decisions move. High-volume operational models are often checked daily or in near real time, while slower processes can be checked weekly. Whatever you choose, review the thresholds and reference data at least quarterly.
Does every drift alert mean I must retrain the model?
No. Many shifts are harmless, and retraining on every alert wastes effort. Check whether performance or a relevant business metric has actually moved, and check for pipeline faults before touching the model.
Does Canada require drift monitoring?
Federal guidance for automated decision systems asks managers to evaluate performance regularly and address model drift. Whether that applies to your organization depends on your sector and use case, so confirm with your compliance or legal team.
Sources
- Frouros: Concepts
- AI-Powered Model Monitoring System with Data Drift Detection and Automated Retraining
- Data Drift in Streaming: Detecting and Managing Unexpected Changes
- Test for non-negligible adverse shifts
- Strengthen data quality, National AI Centre (Australia)
- Implementation guide for managers of Artificial intelligence systems, Government of Canada
- Challenges to the monitoring of deployed AI systems, NIST