Construction Safety Analytics: A Pilot-First Guide for Canadian Sites

Construction safety analytics uses real-time video, sensor data, and machine learning to detect hazards and predict injury risk before incidents occur. For safety managers on Canadian construction sites, the core benefit is simple: you stop reacting to incidents and start intercepting them. If your site has camera coverage, repeatable high-risk tasks, and at least baseline data discipline, analytics can materially reduce exposure to serious injuries and fatalities. If your data quality is poor or frontline buy-in is absent, the technology will underperform regardless of the vendor.
Before you evaluate a single platform, run a readiness check in the next 48 hours:
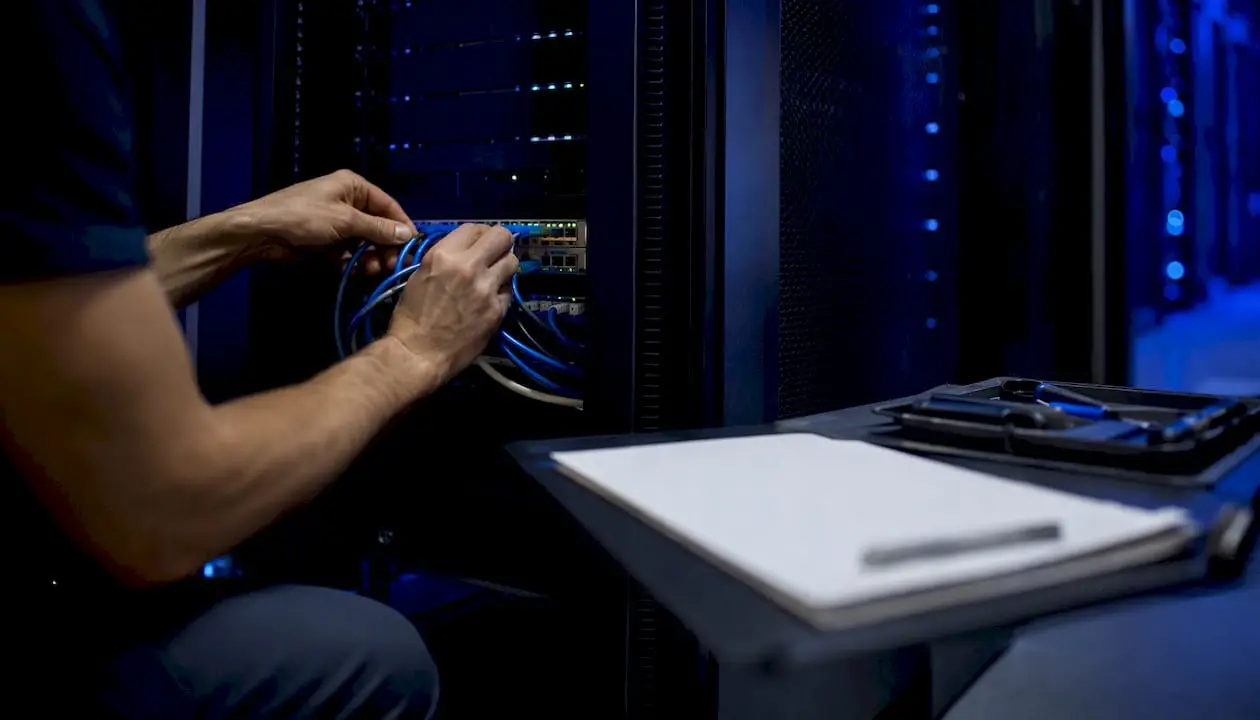
- Do you have reliable network connectivity or edge compute at the camera locations you need?
- Are your incident and near-miss records complete enough to train or validate a model?
- Have you consulted your provincial OH&S regulator and, where applicable, your union on video monitoring consent?
- Can you commit a dedicated data steward and a site supervisor to a 90-day pilot?
If the answer to all four is yes, you are ready to move. If not, fix those gaps first. The Construction Industry Institute’s safety benchmarking data and the INGAA leading safety indicator guidance both point to the same conclusion: analytics built on weak data foundations produces misleading signals that erode trust faster than any single incident.
Key Takeaways
Construction safety analytics delivers measurable value when it is integrated into existing supervision workflows, scoped to 2–3 high-priority use cases, and measured with a 2:1 ratio of leading to lagging indicators from day one.
| Point | Details |
|---|---|
| Run a readiness check first | Confirm connectivity, data quality, consent, and a named data steward before evaluating any platform. |
| Scope the pilot to 2–3 use cases | PPE compliance and restricted-area detection are the fastest to validate; expand only after baseline signal quality is confirmed. |
| Use a 2:1 leading-to-lagging ratio | Track at least two leading indicators (near-miss rate, observation rate) for every lagging metric (TRIR, DART) during the pilot. |
| Validate locally before scaling | Published model accuracy from controlled datasets does not transfer without local labeling, ground-truth validation, and retraining. |
| Benchmark against CII data | CII member TRIR ranges (0.22–0.28) and DART ranges (0.09–0.12) provide realistic baselines; avoid using TRIR as a short-term pilot signal. |
Table of Contents
- How construction safety analytics applies to your highest-risk activities
- What data and technology actually power these systems
- How to run a 90-day pilot on a Canadian construction site
- Which KPIs to track and how to calculate ROI
- Privacy, labour, and regulatory requirements in Canada
- Common failure modes and how to avoid them
- What to look for when evaluating analytics vendors and solutions
- What the research actually says about accuracy and impact
- Why most pilots fail before they start
- Is your site ready? Start here before you commit to a platform
- Sources
How construction safety analytics applies to your highest-risk activities
Not every hazard is equally suited to automated detection. The list below is ordered by how reliably current analytics technology delivers value in field conditions, not by incident frequency alone.
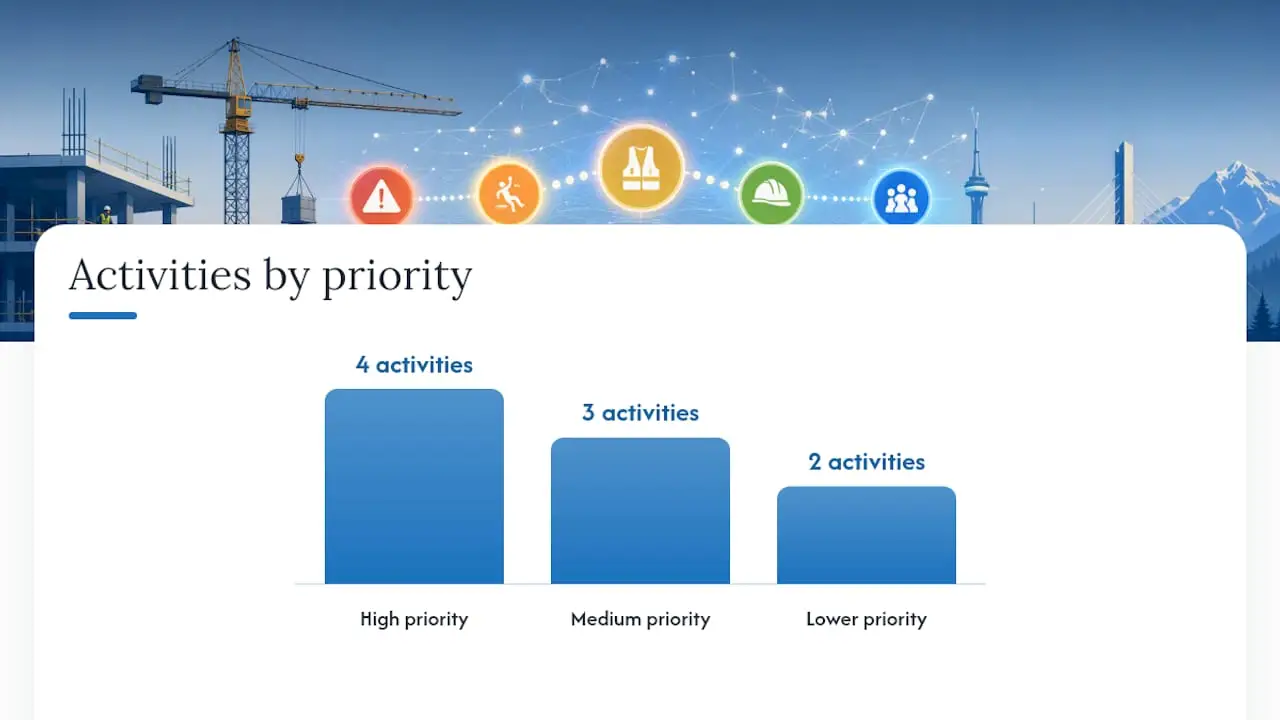
High priority (deploy in Phase 1 of any pilot):
- Falls from elevation. Computer vision on fixed cameras detects workers near unguarded edges or operating without fall arrest. Real-time alerts reach supervisors within seconds. Data source: fixed video. Detection latency: real-time.
- PPE compliance. Helmet, vest, and harness detection is among the most mature use cases. Models trained on large labeled datasets reach high accuracy in controlled conditions. Data source: video. Latency: real-time.
- Restricted-area breaches. Virtual geofencing on camera feeds flags unauthorized entry into exclusion zones around cranes, excavations, and energized equipment. Data source: video plus telematics. Latency: real-time.
- Vehicle/pedestrian conflicts. Camera-based proximity detection combined with telematics alerts when a pedestrian enters a vehicle swing radius. This is a quick win on sites with defined haul roads. Data source: video plus GPS telematics. Latency: near-real-time.
Medium priority (Phase 2, after baseline data is established):
- Struck-by hazards. Detecting unsecured loads, overhead work below unprotected workers, or tool drops requires higher camera density and more complex scene understanding. Data source: video, IoT sensors. Latency: near-real-time.
- Heat stress. Environmental sensors (temperature, humidity, solar load) combined with wearable heart-rate monitors flag workers approaching physiological thresholds. Data source: wearables plus IoT. Latency: near-real-time.
- Lifting and strain risk. Wearable inertial measurement units (IMUs) detect high-risk postures and cumulative load. Useful for repetitive manual handling tasks. Data source: wearables. Latency: batch or near-real-time.
Lower priority (longer lead, requires mature data infrastructure):
- High-Energy Control Assessments (HECA). HECA is a validated leading indicator for serious injury and fatality prevention, recommended by INGAA as part of any analytics program targeting SIF risks. Automating HECA scoring requires integration with permit-to-work systems and structured field observation data. Data source: site systems, structured observations. Latency: batch.
- Electrocution risk. Proximity to overhead power lines requires specialized sensors or drone-based detection. Infrastructure investment is significant. Data source: IoT, drone telemetry. Latency: near-real-time.
The quick wins, PPE compliance and restricted-area monitoring, can show measurable results within the first 30 days of a pilot. Vehicle/pedestrian conflict detection typically takes 60–90 days to tune false-positive rates to an acceptable level.
What data and technology actually power these systems
Data sources
Every analytics system is only as good as its inputs. The primary data streams on a construction site are:
- Site systems. Schedules, permits-to-work, training records, and incident logs. These structured data sources are critical inputs for predictive models and for worksite safety data analysis that goes beyond simple detection.
Core techniques
| Technique | What it does | Typical use case |
|---|---|---|
| Computer vision / object detection | Identifies people, PPE, equipment, and zones in video frames | PPE compliance, restricted-area breach |
| Pose estimation | Estimates body position and joint angles from video | Fall risk, ergonomic strain detection |
| Anomaly detection | Flags deviations from a learned baseline pattern | Unusual equipment behavior, crowd density spikes |
| Ensemble ML (e.g., gradient boosting, random forest) | Combines multiple models to predict incident probability | Predictive risk scoring from historical + real-time data |
| Confidence scores | Quantifies model certainty per prediction | Alert triage, false-positive filtering |
Edge vs. cloud: the tradeoff that drives your budget
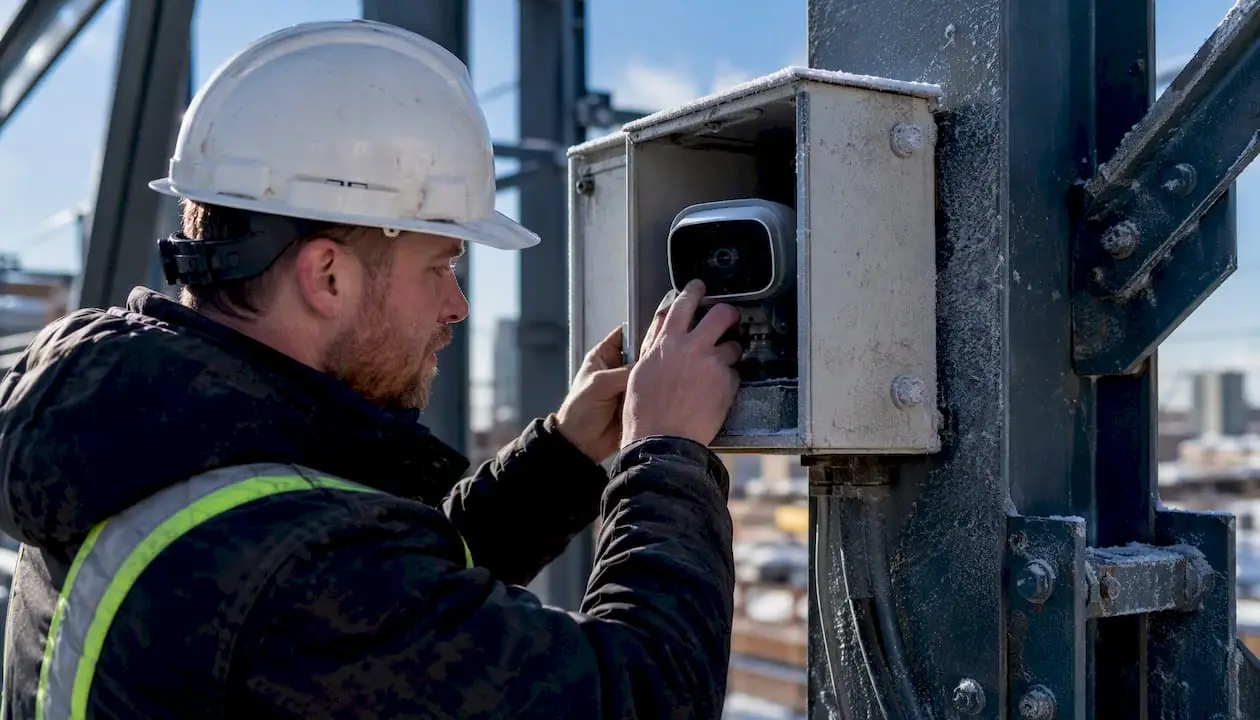
Edge compute runs inference locally on-site, which means low latency (sub-second alerts), reduced bandwidth consumption, and fewer identifiable video frames leaving the site. The tradeoff is higher upfront hardware cost and limited capacity for heavy model retraining.
Cloud processing enables cross-site model training, large-scale analytics, and easier updates, but introduces latency, bandwidth costs, and data residency questions that matter under Canadian privacy law. Most production deployments use a hybrid: edge for real-time detection, cloud for model improvement and enterprise analytics across multiple projects.
Data quality is the single biggest risk. Models trained on noisy labels, unbalanced examples (far more safe observations than hazardous ones), or site-specific conditions that differ from training data will produce unreliable outputs. Ground-truth validation on your own site is not optional. The CDC scoping review of analytics in occupational safety found that data-culture and infrastructure barriers are among the most common reasons pilots fail to reach operational impact.
How to run a 90-day pilot on a Canadian construction site
A 90-day window is long enough to collect meaningful signal and short enough to maintain executive attention. Structure it in three phases.
Phase breakdown
| Phase | Weeks | Key activities | Owner |
|---|---|---|---|
| Plan | 1–3 | Site readiness audit, camera placement design, consent and data governance sign-off, labeling plan, integration mapping | Safety Manager + IT |
| Deploy | 4–8 | Hardware installation, model configuration, frontline training, alert workflow integration, baseline data collection | Vendor + Site Supervisor |
| Validate and iterate | 9 | False-positive rate review, threshold tuning, leading indicator tracking, stakeholder reporting, go/no-go decision | Safety Manager + Data Steward |
Pilot checklist
Site readiness:
- Confirm network connectivity or edge hardware at all planned camera locations
- Map camera fields of view against your top 2–3 target use cases (not all hazards at once)
- Identify blind spots and plan supplementary sensor placement
Data governance:
- Draft a video retention policy (recommend 30–72 hours for operational footage unless flagged)
- Prepare worker consent notices aligned with PIPEDA and applicable provincial OH&S requirements
- Define access controls: who can view raw footage vs. anonymized analytics outputs
Labeling and validation:
- Allocate budget for ground-truth labeling of at least several hundred representative examples per use case
- Plan a mid-pilot validation review at week 6 to catch model drift early
Integration:
- Map alert outputs to your existing HSE ticketing or corrective-action workflow
- Confirm that the safety compliance workflow can receive structured data from the analytics platform
Frontline training:
- Run a one-hour orientation for site supervisors covering what the system detects, how alerts are triaged, and what actions are expected
- Clarify that analytics supports supervision, it does not replace it
Success criteria template
Define these before you deploy, not after:
- False-positive rate below 15% for primary use cases by week 8
- Alert response time under 10 minutes for high-priority events
- Near-miss reporting rate increases by at least 20% versus the pre-pilot baseline
- Observation rate (leading indicator) improves week-over-week through the pilot
Pro Tip: Tie alerts directly into your existing supervisor radio or messaging channel rather than requiring supervisors to check a separate dashboard. Systems that add a new screen to an already-busy workflow get ignored. The 90-day pilot guide for jobsite AI covers this integration pattern in detail.
Which KPIs to track and how to calculate ROI
Leading vs. lagging indicators
Lagging indicators (TRIR, DART, days away from work) tell you what already happened. Leading indicators tell you whether your controls are working before an incident occurs. INGAA’s leading safety indicator program recommends a 2:1 ratio of leading to lagging indicators for ongoing monitoring. For a pilot, that means tracking at least two leading metrics for every lagging one you report.
Core metrics
CII’s corporate safety benchmarking is explicit that TRIR is statistically noisy on small projects. A single recordable incident on a 50-person site can swing TRIR dramatically. Use it for trend analysis over quarters, not as a week-to-week pilot signal.
Sample ROI formula
A defensible business case does not require precision. Use this structure:
Avoided incident cost estimate:
(Estimated incidents per year × average direct + indirect cost per incident) × expected reduction percentage
Time savings estimate:
(Hours per week spent on manual observation and reporting × cost per hour) × weeks in year
Total annual benefit = avoided incident cost + time savings
Use the workflow automation benefits calculator to model the time-savings component against your current manual processes.
Privacy, labour, and regulatory requirements in Canada
Canadian construction analytics deployments operate under federal and provincial privacy law simultaneously. Getting this wrong before deployment is far more costly than getting it right upfront.
PIPEDA considerations
The Personal Information Protection and Electronic Documents Act (PIPEDA) governs how federally regulated employers collect, use, and disclose personal information, including video footage of identifiable workers. Key obligations before you record:
- Purpose limitation. Collect video only for the specific safety purposes you have documented. Using footage for performance management without separate consent is a PIPEDA violation.
- Data minimization. Record only what is necessary. Edge-first processing that anonymizes or blurs identifiable features before transmission reduces your exposure significantly.
- Retention limits. Define and enforce a retention schedule. Footage not flagged for an incident or investigation should be deleted within your documented window.
- Secure storage. Encrypted storage, access logs, and role-based access controls are baseline requirements.
Note that Alberta, British Columbia, and Quebec have substantially similar provincial privacy legislation (PIPA in Alberta and BC; Law 25 in Quebec) that may apply instead of PIPEDA depending on the nature of the work and employer. Confirm jurisdiction with your legal counsel before deployment.
Provincial OH&S and labour considerations
Most provincial OH&S regulations require employers to consult with joint health and safety committees (JHSCs) before introducing new monitoring technology. In unionized environments, video monitoring may also be subject to collective agreement provisions. Notify your JHSC and, where applicable, your union representative before the pilot begins, not after.
Compliance checklist before deployment:
- Written purpose statement for video collection (safety use only)
- JHSC consultation documented and signed
- Union notification completed (if applicable)
- Worker notice posted at site entry points
- Data retention and deletion schedule documented
- Access control policy drafted and approved
- Data residency confirmed (Canadian servers or cross-border transfer agreement in place)
- Legal and privacy officer sign-off obtained
Common failure modes and how to avoid them
The CDC scoping review examined over 300 articles on analytics in occupational safety and found that most studies focus on method development rather than demonstrated field impact. The gap between a model that performs well in a lab and one that works reliably on a live Canadian construction site in February is substantial.
False positives. The most common complaint from frontline supervisors. A system that fires 40 alerts per shift for non-events gets ignored within a week. Mitigate by setting conservative confidence thresholds at launch, tuning aggressively in weeks 4–6, and establishing a human-in-the-loop triage step for any alert before it reaches a supervisor.
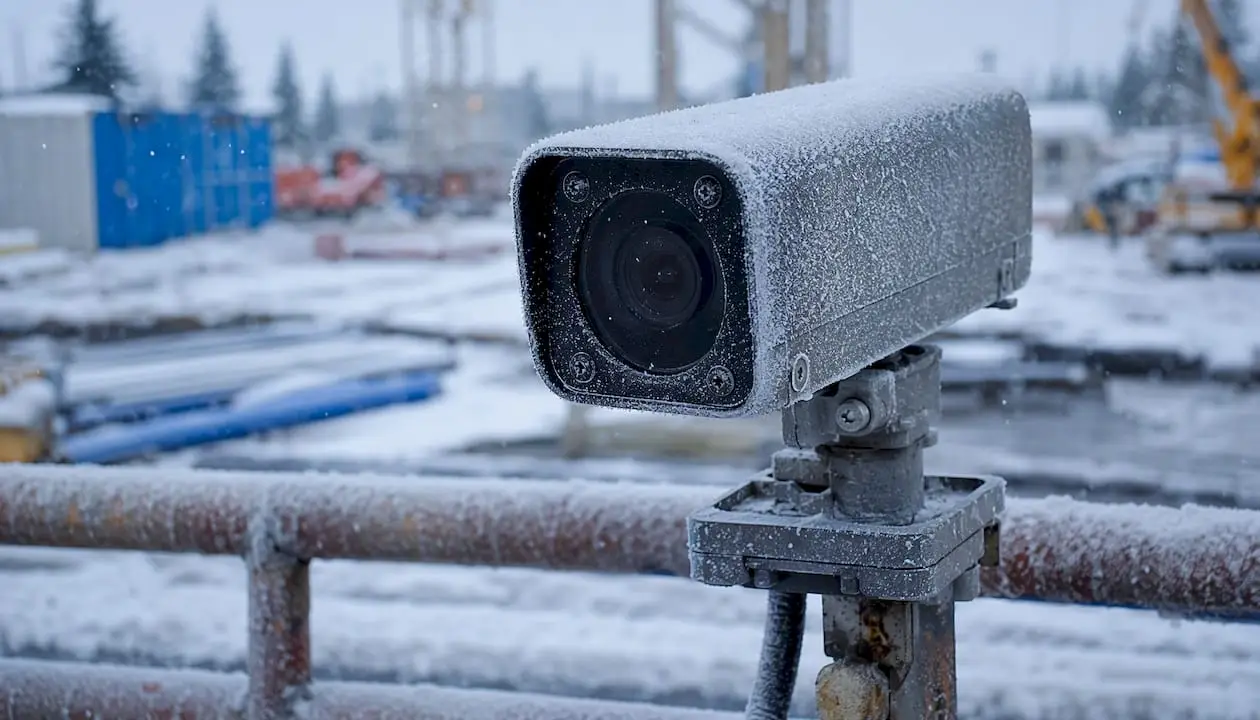
Camera blind spots and weather effects. Snow, rain, dust, and direct sunlight degrade video quality in ways that controlled-dataset accuracy figures do not capture. Plan camera placement with Canadian weather in mind: heated enclosures, wiper systems for outdoor cameras, and supplementary sensor coverage for areas where video is unreliable.
Model drift. A model trained on summer site conditions will degrade as the site layout changes, crews rotate, or seasons shift. Schedule retraining reviews at 90-day intervals and monitor confidence score distributions as an early warning signal.
Noisy baseline data. Building analytics on top of incomplete incident records or inconsistently reported near-misses produces misleading risk scores. Establish a data quality baseline before the pilot and assign a data steward to maintain it.
Workforce mistrust. Workers who believe analytics is surveillance will under-report near-misses and avoid camera-covered areas. Address this directly in the frontline orientation: explain what is detected, what is not stored, and who can access footage. Transparency is the fastest path to adoption.
Over-reliance on a single data stream. A video-only system misses heat stress, ergonomic risk, and gas exposure. Plan for multi-sensor integration from the start, even if you deploy sensors in phases.
The mitigation that cuts across all of these: start with 2–3 core safety activities, not a comprehensive monitoring program. Practitioners consistently find that tracking everything at once leads to data abandonment and poor results. Nail the first use cases, then expand.
What to look for when evaluating analytics vendors and solutions
The vendor market for construction safety analytics spans four broad categories. No competitor names appear here because the evaluation criteria matter more than any specific brand.
Edge-focused video analytics platforms prioritize low-latency on-site inference. Evaluate: hardware requirements, offline capability (critical for remote Canadian sites), and how model updates are delivered without cloud dependency.
Cloud-native platforms with cross-site models offer faster model improvement through aggregated data across many sites. Evaluate: data residency (Canadian servers or contractual guarantees), latency for real-time use cases, and what happens to your data if you terminate the contract.
Integrated safety platforms combine analytics with HSE workflow management, corrective action tracking, and reporting. Evaluate: API openness for integration with your existing construction project management software, and whether the analytics module is genuinely embedded or bolted on.
Systems integrators and custom development partners build tailored solutions that connect analytics outputs to your specific workflows and data environment. Evaluate: local Canadian presence, bilingual support where required, and experience with your provincial regulatory environment.
Procurement criteria checklist:
- Data governance documentation (retention, deletion, access controls)
- Model explainability: can the vendor show you why an alert fired?
- Integration APIs: does it connect to your existing HSE and project management systems?
- Offline/edge capability for remote or low-connectivity sites
- Local Canadian support and data residency options
- Pricing model: subscription, per-seat, or project-based, and what happens at scale
- Pilot-to-production pathway: what does the vendor commit to during a 90-day trial?
For business intelligence automation that connects analytics outputs to broader operational reporting, confirm the vendor supports standard data export formats (CSV, JSON, REST API) so you are not locked into a proprietary reporting layer.
What the research actually says about accuracy and impact
Academic ML studies in construction safety report high model accuracy on experimental datasets. One ensemble ML study reported strong predictive performance on controlled data, which is a meaningful signal about what the technique can do. It is not a guarantee of what it will do on your site in March with a rotating crew and a camera mounted 40 feet from the work face.
A peer-reviewed study on applied ML in safety contexts reinforces the same point: model performance in controlled settings often does not generalize without local data collection, ground-truth labeling, and retraining. Published accuracy figures are a starting point for vendor conversations, not a procurement decision.
The CDC scoping review synthesized over 300 articles and concluded the field is promising but early-stage. Most published work focuses on method development. Demonstrated, field-proven impact at scale remains limited, and data-culture barriers are consistently cited as the primary obstacle.
CII’s benchmarking data provides the most reliable industry baselines for TRIR (0.22–0.28) and DART (0.09–0.12) among member respondents, but explicitly cautions that TRIR is statistically variable and should not be used as a short-term predictive signal. Use it to contextualize your site’s performance against industry peers, not to measure week-to-week pilot impact.
The practical implication: treat published accuracy figures as capability evidence, not performance guarantees. Budget for local validation and retraining as a non-negotiable line item in your pilot plan.
Why most pilots fail before they start
The pattern is consistent across implementations: a team selects a platform, installs cameras, and waits for insights. Six months later, the dashboard is full of alerts nobody acted on, the data steward role was never filled, and the frontline crew has learned to walk around the camera coverage.
The technology is rarely the problem. The failure almost always traces back to one of three things: analytics treated as a separate layer rather than integrated into existing supervision workflows, a pilot scope that tried to monitor everything at once, and a readiness check that was skipped because the vendor said the system was “plug and play.”
What actually works is narrower than most vendors suggest. Pick two use cases where you have camera coverage and a clear corrective-action workflow already in place. Define what a successful alert response looks like before the system goes live. Assign one person who owns the data and one supervisor who owns the response. Then run the 90 days with those constraints and measure against the leading indicators you defined upfront.
The INGAA leading indicator guidance and CII benchmarking both point to the same conclusion: the organizations that get durable value from safety data are the ones that build a measurement culture first and add technology second. Analytics accelerates a culture that already exists. It cannot create one.
If you are unsure where your organization sits on that spectrum, an AI readiness audit is the fastest way to find out before committing to a platform.
Is your site ready? Start here before you commit to a platform
Digitalfractal works with Canadian construction companies to assess analytics readiness, design pilot programs, and integrate AI outputs into existing safety workflows. The process starts with an AI audit and opportunity assessment that maps your current data infrastructure, identifies the 2–3 use cases with the highest ROI potential, and produces a scoped pilot plan you can take to your executive team.
If you want to self-assess first, the digital transformation readiness checker gives you a structured baseline in under 20 minutes. For teams ready to move directly to implementation, Digitalfractal’s AI integration consulting covers the full path from readiness to production.
Sources
These sources are worth consulting directly when planning a pilot, drafting governance documentation, or building a business case.
- Implementation of Standardized Leading Safety Indicators in Contractor Safety Management Programs
- CII corporate safety benchmarking (resource download 11506)
- Scoping review: analytics in occupational safety (CDC stacks)