
CFO Ready Predictive Maintenance ROI From a 90 Day Pilot

Predictive maintenance pays for itself in most industrial settings, but only when it’s scoped to critical, high-failure-cost assets and measured against the right baseline. The single biggest way to inflate or deflate those numbers is picking the wrong starting point for comparison, and letting false positives from a noisy sensor feed quietly eat the gains before anyone notices.
TL;DR:
- ROI estimates are most reliable when comparing predictive maintenance against a reactive baseline and focusing on high-criticality, high-failure-cost assets.
- The conservative expected ROI range falls between 8 and 12% savings over preventive maintenance, with the ideal payoff within 12 to 14 months in a well-executed pilot.
- All five value pillars, including downtime reduction, maintenance cost savings, spare-part optimization, asset life extension, and energy efficiency, should be integrated into the business case.
- Pilot-to-rollout timelines usually span 6 to 12 months, with the best results achieved when selecting high-failure-history assets and accurately modeling false positives and integration costs.
- Proper upfront planning, including a rigorous data readiness assessment and staged pilot execution, is critical to securing long-term funding and avoiding inflated or unsubstantiated benefit claims.
Table of Contents
- How Reliable Are Published Predictive Maintenance ROI Benchmarks?
- Where Predictive Maintenance ROI Actually Comes From
- How Do You Calculate Predictive Maintenance ROI?
- What Do Real Predictive Maintenance Case Studies Show?
- Why Do Predictive Maintenance ROI Estimates Often Fall Apart?
- What Does a 90-Day Predictive Maintenance Pilot Look Like?
- Turning the Analysis Into an Approved Budget
- Turn Your Predictive Maintenance Business Case Into Funded Reality
- Sources
- FAQ
How Reliable Are Published Predictive Maintenance ROI Benchmarks?
The honest answer: reliable enough to build a budget request, as long as you know which number applies to your situation and which one is aspirational.
The U.S. Department of Energy’s Operations & Maintenance Best Practices guide is the most conservative, defensible source in the space. That number gets quoted constantly in vendor decks, but it comes from a narrow set of mature, high-discipline operations. Treat it as a ceiling, not a planning assumption.
On the higher end, NIST’s review of advanced maintenance techniques documents firm-level case studies with maintenance-cost reductions up to 33%, with some examples approaching a 10:1 return. NIST is upfront that these results vary enormously by asset type, industry, and what baseline the company started from. A plant replacing chaotic reactive maintenance with PdM will show far larger gains than one that already ran disciplined preventive schedules.
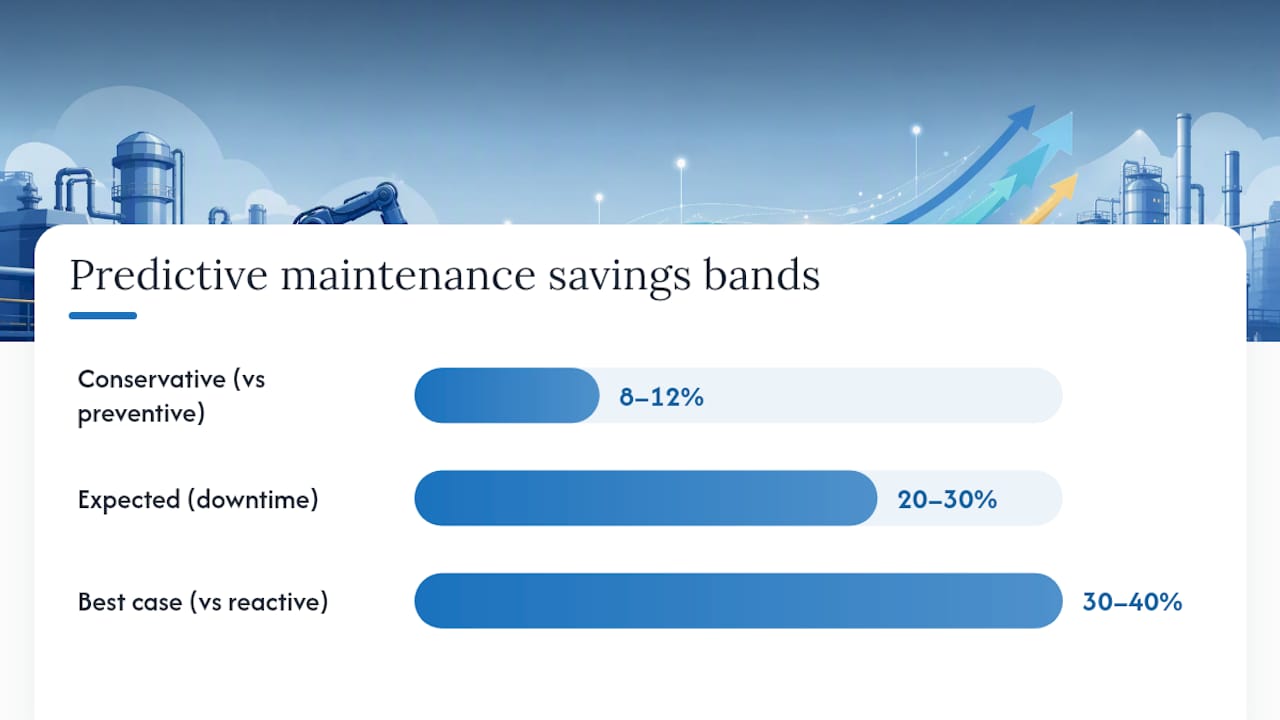
Three bands are useful when you present numbers upward:
- Conservative: 8 to 12% savings over preventive maintenance, per DOE guidance. Use this in the budget ask itself.
- Expected: 20 to 30% reduction in unplanned downtime once a program matures, consistent with vendor and analyst reporting from firms like Siemens.
- Best case: 30 to 40% savings over reactive baselines, or higher in firm-level case studies documented by NIST.
Pro Tip: Present the conservative band as your baseline case and the expected band as the “if the pilot performs as designed” scenario. Never lead with a best-case number in front of a CFO. If it isn’t hit, the whole business case looks inflated retroactively, even if the program is still profitable.
Where Predictive Maintenance ROI Actually Comes From
Downtime avoidance usually dominates the conversation, but it’s only one of five value pillars, and a credible business case needs all five accounted for, even conservatively.
- Downtime avoidance. Multiply the hourly throughput value of the line by the hours of unplanned downtime you expect to prevent. This is almost always the largest line item on a bottleneck asset.
- Maintenance spend reduction. Overtime pay, emergency contractor call-outs, and expedited parts freight all drop when work shifts from reactive to planned. Compare planned versus emergency labor hours over the trailing 12 months to size this.
- Spare-parts optimization. Better failure prediction reduces the safety stock you carry and cuts the premium you pay for rush shipping. Carrying cost alone can run several percentage points of inventory value per year.
- Asset life extension. Catching problems before they cascade into major failures defers capital replacement. Model this conservatively: a few extra years of service life on a mid-life asset, not a doubling of useful life.
- Energy and quality gains. Include these only when your data supports it. Energy.gov’s operations and maintenance guidance links well-maintained equipment to measurable efficiency gains, but this pillar is easy to overstate without direct measurement.
Skipping the smaller pillars is the most common way maintenance teams undersell their own program. A CFO wants the full ledger, not just the headline downtime number.
How Do You Calculate Predictive Maintenance ROI?
Building a defensible ROI model starts with gathering five inputs, most of which already live in systems you have.
- Asset criticality and failure cost. Pull historical downtime incidents and their financial impact from your CMMS.
- Current maintenance spend. Labor hours, contractor invoices, and parts costs by planned versus emergency category, usually from ERP financial records.
- Production value per hour. Get this from operations or finance, not maintenance. It’s the number that turns downtime hours into dollars.
- Implementation cost. Sensors, platform licensing, integration labor, and training. Monitory’s ROI resource breaks this into a useful year-by-year cost and benefit table for business-case modeling.
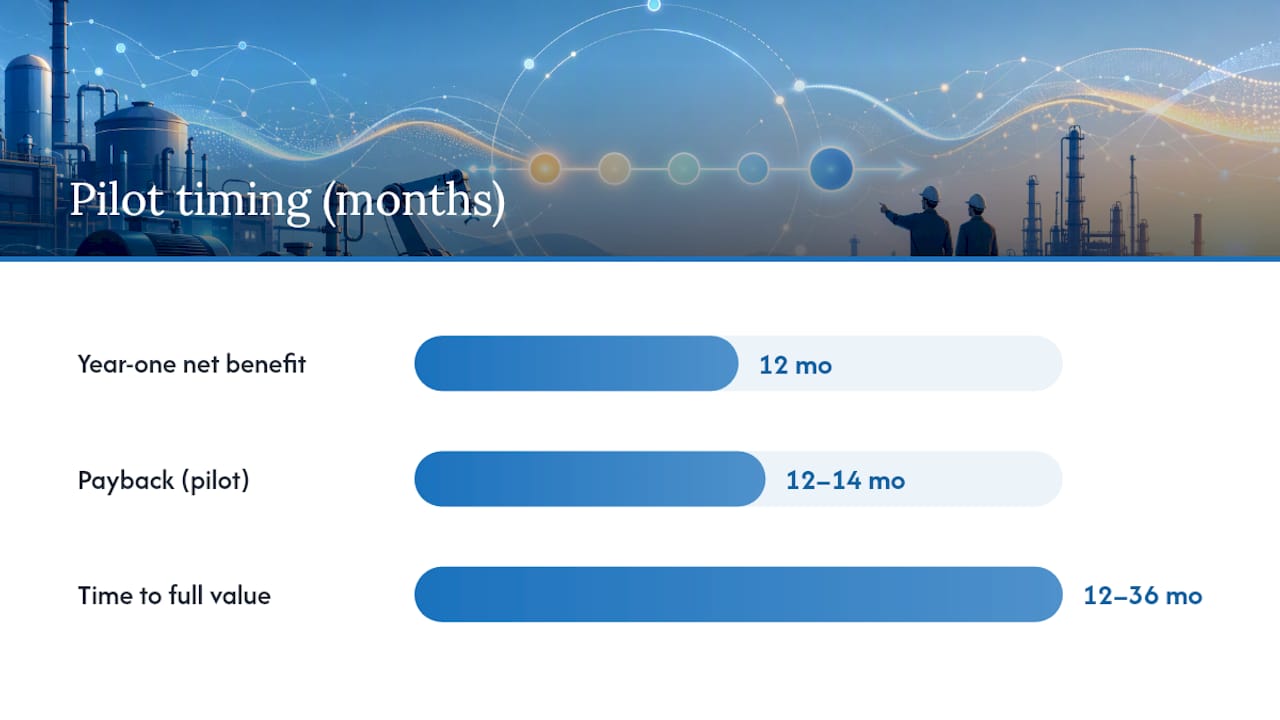
- Time horizon. Most programs need 12 to 36 months to reach full value, which is the window for your NPV and IRR calculations.
Here’s a worked example for a single bottleneck line, using DOE’s conservative benchmark as the anchor:
Even the conservative column clears a positive net benefit in year one, and payback lands inside 12 to 14 months once you annualize the upfront sensor and integration spend. That’s the number to walk into a finance review with. The expected and upside columns become your sensitivity range, not your headline claim.
To scale from one asset to a fleet, apply aggregation rules rather than simple multiplication. Not every asset will hit the same downtime-avoidance rate as your pilot line, since failure modes and criticality differ across equipment types. Once you’re modeling more than a handful of assets, a Monte Carlo simulation that treats each asset’s savings as a probability distribution, rather than a fixed number, gives finance teams a payback-period confidence range instead of one hopeful figure.
Stress-test these five assumptions before anyone else does: production value per hour, false-positive rate, sensor and integration cost overruns, downtime-hours-avoided percentage, and the discount rate used in your NPV calculation.
What Do Real Predictive Maintenance Case Studies Show?
Published results cluster into a fairly narrow story: pilots on well-chosen assets pay back fast, and the accuracy of the prediction model is what separates a strong result from a mediocre one.
- DuPont’s proof-of-concept deployment reported a 7x ROI within under a year at pilot sites, driven by high prediction accuracy and low deployment friction. Treat this as a best-case illustration, not a typical outcome. Most programs won’t match it in the first cycle.
- Verdantix’s validated financial modeling for mid-sized manufacturers shows substantial multi-year ROI when companies pilot on a single high-value bottleneck asset before expanding, rather than deploying broadly on day one.
- Siemens’ scaling data shows unplanned downtime reductions around 20% are realistic once data maturity improves, and that payback timelines shorten meaningfully as historical sensor data accumulates.
The pattern across all three: pilot-to-rollout timelines of roughly 6 to 12 months, with payback on the pilot itself typically landing inside the first year when the pilot asset is chosen for its failure history and criticality, not its convenience.
Why Do Predictive Maintenance ROI Estimates Often Fall Apart?
Most failed business cases don’t fail because the technology didn’t work. They fail because the math was built on shaky assumptions from day one.
- False positives get ignored in the budget. Every alert that turns out to be nothing still costs a technician’s time and an unplanned inspection. Budget for a false-positive rate, don’t assume zero.
- Baseline mismatch inflates the pitch. Comparing a new PdM program against a chaotic reactive baseline, then presenting that improvement as if it applies to an already-disciplined preventive shop, is the fastest way to lose credibility with finance.
- Data and integration costs hide in the corners. Sensor retrofits, historian access, and CMMS or ERP integration work routinely run over initial estimates. Audit these costs before you finalize the model, not after the invoice arrives.
That’s the gap between a business case that gets funded again next year and one that gets quietly shelved.
Pro Tip: Ask your data science or IT partner for a documented false-positive rate from a comparable deployment before you finalize your model. If they can’t produce one, treat that as a red flag about how mature their prediction pipeline really is.
What Does a 90-Day Predictive Maintenance Pilot Look Like?
A pilot built to produce board-ready numbers follows a tight cadence rather than an open-ended exploration.
- Days 1 to 20: Scope the pilot asset, pull 12 to 24 months of historical failure and cost data from the CMMS and ERP, and confirm sensor or data feed availability.
- Days 21 to 45: Deploy sensors or connect existing data streams, validate signal quality, and begin model tuning against known failure patterns.
- Days 46 to 75: Run the prediction model live alongside normal operations, tracking predicted versus actual failures and false-positive rates.
- Days 76 to 90: Package results into a finance-ready spreadsheet and slide deck, using the conservative, expected, and upside framing from your ROI model.
| Milestone | KPI collected | Feeds into |
|---|---|---|
| Data readiness | Sensor coverage %, data completeness | Baseline accuracy |
| Model validation | Prediction accuracy, false-positive rate | Sensitivity analysis |
| Financial reporting | Downtime avoided, spend reduction | NPV/IRR/payback model |
Turning the Analysis Into an Approved Budget
Week one is about picking the right pilot asset and pulling clean baseline data, not building spreadsheets. That single decision determines whether your entire business case holds up under scrutiny later. Month one should produce a documented readiness assessment and a finance KPI list agreed on with your CFO’s office before any sensor gets installed. By the end of quarter one, you want measured pilot results and a scaling recommendation on the table, not a promise. The organizations that get PdM funded a second time are the ones that treated the pilot as a financial experiment, not a technology demo.
— Souhail
Turn Your Predictive Maintenance Business Case Into Funded Reality
This approach shortens the distance between “we think PdM would pay off” and a board-ready number your CFO signs off on. Instead of a generic consulting engagement that spends months on discovery before touching your actual data, Digitalfractal starts with an AI Readiness Audit that scopes your pilot asset, validates sensor and data quality, and builds the ROI spreadsheet alongside you, inside a 90-day window.
The audit identifies where your CMMS and ERP data is clean enough to model confidently and where gaps need addressing before a single sensor goes live. From there, a tailored pilot targets the bottleneck asset most likely to produce a defensible payback figure within the first year, following the same pilot-first approach that Verdantix’s research recommends for mid-sized manufacturers. If your team also needs the pilot logic mapped against logistics operations specifically, the predictive maintenance logistics playbook walks through that scenario directly. Book the AI Readiness Audit and get your conservative, expected, and upside numbers built out before your next budget cycle closes.
Sources
- NIST.AMS.100-18: Review of advanced maintenance techniques and their impacts (NIST)
- Verdantix: Best practices transitioning to predictive maintenance
- Maximising your ROI with scalable predictive maintenance (Siemens ROI report)
FAQ
What Are TBM and CBM in Maintenance?
Time-based maintenance (TBM) services equipment on a fixed schedule regardless of condition, while condition-based maintenance (CBM) triggers service based on real-time equipment data. Predictive maintenance is a more advanced form of CBM that forecasts failure before it happens rather than reacting to a threshold being crossed.
What Are Some Examples of Predictive Maintenance?
Common examples include vibration analysis on rotating equipment, thermal imaging on electrical panels, oil analysis on hydraulic systems, and acoustic sensors on bearings, all feeding data into a model that predicts failure windows before breakdown occurs.
What Are the Three P’s of Maintenance?
Definitions vary across organizations, but a commonly cited version refers to people, process, and parts, the three resource categories that a maintenance strategy has to align to deliver measurable savings.
How Long Does It Take to See Predictive Maintenance ROI?
Pilot programs on well-chosen critical assets typically show measurable payback within 12 to 14 months using conservative assumptions, while mature, fleet-wide programs can extend the higher savings percentages documented by DOE across a longer multi-year horizon.