
Customer Churn Prediction for B2B: A Practical Guide

B2B churn prediction scores every account for its likelihood of leaving within a set window, so account managers act months before a renewal is at risk. It works when four things are settled before any modeling starts: a precise definition of churn, clean account-level data, a metric tied to the cost of a missed account, and a workflow that puts the score in front of someone who can act. The model is the smallest part of that list. Most B2B projects stall on the other three, and an AI readiness audit is the fastest way to find out which one is holding you back.
This guide is written for operators: logistics firms, service businesses and software teams with a few hundred or a few thousand accounts, where each contract carries real revenue.
TL;DR
- B2B churn is rare, slow and contract-driven, so the prediction target must be defined per account and tied to the renewal calendar, not copied from a consumer template.
- Your data decides the result. CRM records, billing, usage and support tickets must share one account ID before a model can learn anything.
- Accuracy misleads when few accounts churn. Judge a model on recall, precision and a ranking metric, weighted by what a lost account costs you.
- A score has value only when it lands in the tools account managers already use, with a defined save play attached.
- A 90-day, tailored build beats a generic template because your contracts, systems and signals are specific to you.
Table of Contents
- What churn prediction means in a B2B business
- Decide what counts as churn first
- The data a B2B churn model needs
- Building and validating the model
- Metrics that show whether the model is useful
- Turning scores into retention actions
- Moving from monthly reports to near-real-time scoring
- Where B2B churn projects go wrong
- Perspective: why a tailored build beats a template
- How Digital Fractal helps
- FAQ
- Sources
What churn prediction means in a B2B business
Churn prediction uses historical customer data to estimate which accounts will stop buying within a defined period. The output is a probability per account, for example a 70% likelihood of not renewing in the next 90 days. That number lets you rank accounts and spend retention effort where it matters most.
The B2B version differs from the consumer one in three ways.
Volume is small. A consumer subscription business may score millions of users. A B2B firm may score 400 accounts, where one loss is 5% of revenue. Small samples demand simpler models and more careful validation.
Churn happens on a calendar. On an annual contract, an account cannot leave in month five. Risk concentrates at renewal, so the model needs to know how many days remain on the contract.
Causes are spread across the organization. A late delivery, a champion who changed jobs, a missed service-level target and a competitor’s discount can all contribute. No single system records all of it, which is why data integration, not algorithm choice, is the hard part.
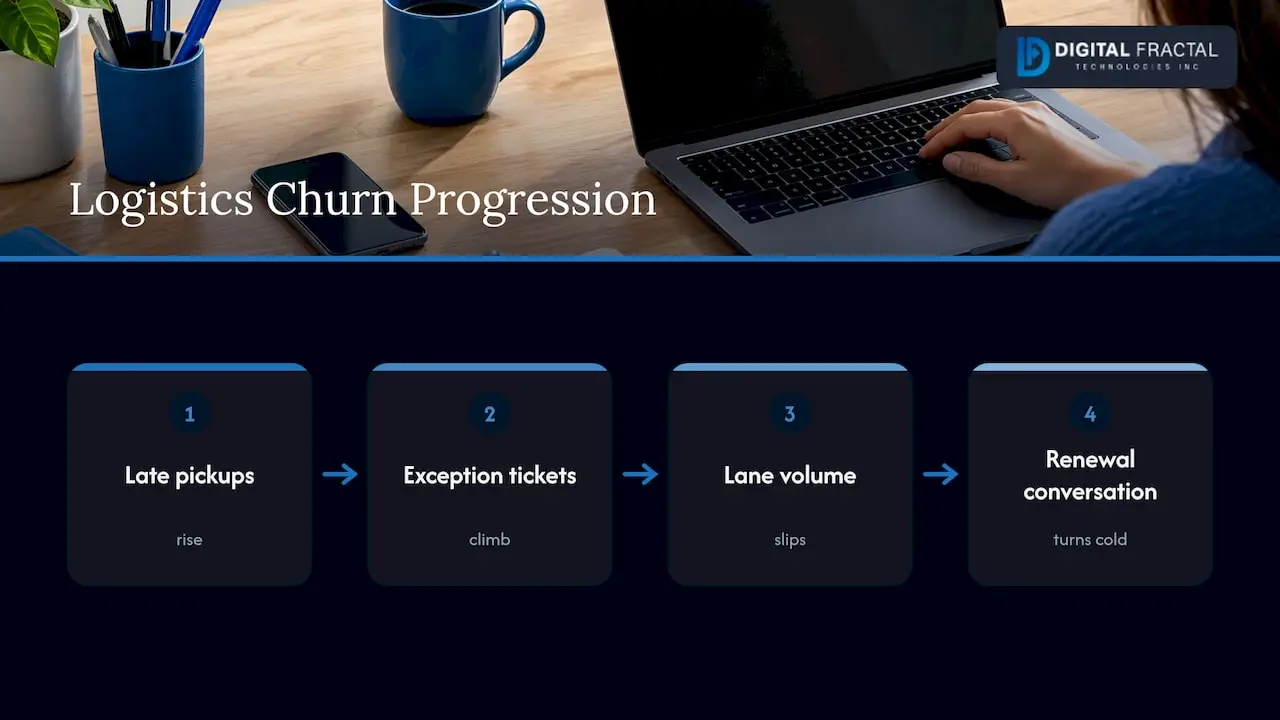
In logistics, for instance, a shipper rarely cancels in a single decision. Late pickups rise, exception tickets climb, order volume per lane slips, and then the renewal conversation turns cold. Each of those signals sits in a different system.
Decide what counts as churn first
The most common early mistake is building a model before agreeing on the label. “Churn” can mean at least four different things in a B2B business:
- Logo churn: the account cancels or does not renew its contract.
- Revenue churn: the account stays but cuts volume, seats or services.
- Passive churn: the contract lapses with no formal cancellation.
- Involuntary churn: payment failures end the relationship, which is a billing problem rather than a loyalty one and should be modeled separately.
Pick one primary definition, write it down and get sales, finance and operations to sign off. Then fix three parameters:
- The population. Which accounts are active on the date you score them? Exclude accounts already in a notice period, since their outcome is known.
- The window. How far ahead are you predicting? Thirty days is too late for an enterprise renewal. A window that covers the full renewal cycle gives account managers time to act, and longer contracts need longer windows.
- The unit. Score at the account level. If you sell several products or run several lanes or sites per customer, add a second score at that level later.
A tight label is worth more than a clever algorithm. If “churn” means different things in the CRM and in finance, the model will learn the disagreement rather than the pattern.
The data a B2B churn model needs
A workable first model draws on five groups of data, all joined on one consistent account ID:
| Data group | Examples | Where it usually lives |
|---|---|---|
| Account profile | Industry, size, region, contract start, contract value, days to renewal | CRM |
| Transactions | Invoices, order volume, payment delays, discounts, past renewals | Billing or ERP |
| Usage or operations | Logins, feature use, shipments per month, API calls, order frequency | Product database, TMS, operational systems |
| Support | Ticket count, severity, time to resolve, unresolved issues | Help desk |
| Engagement | Meetings, emails, executive contact, champion changes | CRM, email |
Two practical points matter here.
First, you need history. Pull several years of renewals, each labeled as renewed or churned, and capture the signals as they stood before the outcome was known. If you include anything recorded after the customer gave notice, such as a cancelled business review, the model looks brilliant in testing and fails in production. This is called data leakage.
Second, much of the most predictive information is never recorded. A budget freeze or a departing sponsor does not appear in usage logs unless someone enters it in the CRM. Cleaner, richer CRM records often improve predictions more than a change of model. Our guides on AI-driven CRM data enrichment and enterprise data readiness cover how to close those gaps. The same groundwork applies to AI lead scoring in Canada, since both projects depend on the same account data.
Building and validating the model
You do not need deep learning for a first B2B churn model. Published work on B2B churn leans on interpretable methods. One study in the Journal of Big Data followed the six-phase CRISP-DM lifecycle (business understanding, data understanding, data preparation, modeling, evaluation, deployment). It used a decision tree to identify the attributes of churned customers and K-means clustering to test whether churned and retained customers form distinct groups. That route is realistic for a firm with a few hundred accounts, because a decision tree shows which attributes drive risk and you can explain it to a sales director.
Academic comparisons of more complex methods show the trade-off. A 2021 Simon Fraser University thesis evaluated two neural approaches on real telecom call-activity data. The simpler multilayer perceptron beat the sequence-based model on AUC, precision and recall, while the more elaborate model took longer and needed retraining. More complexity does not guarantee a better result.
A sound build follows this order:
- Assemble and label the dataset using your agreed definition.
- Split by time, not at random. Train on older renewals and test on newer ones, which mirrors how the model will be used.
- Start with a baseline such as logistic regression or a decision tree, then try gradient-boosted trees if the baseline leaves room.
- Handle class imbalance. If 90% of renewals succeed, a model that predicts “everyone renews” scores 90% accuracy and finds no one at risk. Weight the churned accounts more heavily or resample.
- Calibrate the scores. A score of 72 is only a 72% chance of churn if you have checked it against real outcomes.
- Review the top drivers per account so each alert comes with a reason.
A model that is simple, calibrated and explained will be used. An opaque one tends to be ignored by the people who need to act on it.
Metrics that show whether the model is useful
Accuracy is the wrong headline metric when few accounts churn. Read these together:
- Recall: the share of accounts that actually churned that the model flagged.
- Precision: the share of flagged accounts that actually churned.
- F1: a single figure that balances recall and precision.
- ROC-AUC or PR-AUC: how well the model ranks risky accounts above safe ones. In the Data Science for Managers course text, an AUC near 1.0 is best and 0.5 is no better than guessing.
The right balance depends on cost. The same text works through an example: if a $100 retention rebate is cheaper than the $500 in average revenue a churned customer takes with them, then missing a churner costs more than offering an unnecessary rebate. So the decision threshold should be set by those business costs, not by a default cutoff.
Apply that to B2B. If an account is worth $120,000 a year and a save play costs a few hours of an executive’s time, you want high recall: flag generously and accept some false alarms. If the save play is a significant discount, precision matters more, because every false positive costs margin.
A worked example
Suppose a freight forwarder has 300 accounts and 30 of them churned last year (10%). A model flags 60 accounts, and 24 of those are real churners.
- Recall is 24 of 30, or 80%.
- Precision is 24 of 60, or 40%.
- Six churners were missed.
Precision of 40% sounds weak until you price it. If the average account is worth $90,000 a year and a save play costs about $1,500 in staff time, spending $90,000 on 60 plays protects up to 24 accounts worth $2.16 million. The model pays for itself even with most alerts being false alarms. (The figures are illustrative, not client results.)
Turning scores into retention actions
A score nobody acts on is a dashboard decoration. Four design choices decide whether the model changes renewals.
Put the alert where people already work. Push high-risk accounts into the CRM or the account manager’s task list, not a separate analytics page.
Tie each tier to a play.
- High risk, high value: an executive-sponsored review and a documented recovery plan.
- A champion has left: re-map stakeholders at the account immediately.
- Medium risk: re-engagement, training or an onboarding refresh.
- Low risk with growth signals: an expansion conversation.
Show the reason. “Order volume down 40% in 60 days, three unresolved tickets” gives the account manager a first sentence for the call. A bare number does not.
Close the loop. Record which accounts received a save play and what happened. Feed that back into training data each quarter so the model learns from your interventions as well as from raw behavior.
For logistics firms the signals are operational: on-time performance by lane, claims, exception volume, quote-to-booking ratios and shifts in shipment mix. These change daily, which raises the question of how fresh the scores need to be.
Moving from monthly reports to near-real-time scoring
Many firms start with a batch score refreshed weekly or monthly, and that is enough for annual contracts. Real-time scoring matters when signals move fast: transactional logistics accounts, usage-based pricing or short contracts.
The architecture is well documented. Microsoft’s Fabric Real-Time Intelligence reference describes streaming CRM, application log and engagement data into one store, scoring a predictive model against it as events arrive, generating risk alerts and triggering outreach automatically, with dashboards monitoring the scores. The pattern is the same whatever stack you run: a stream of events, a scoring step, an alert and an action.
The integration work is where projects succeed or stall. You need connectors between operational systems, the CRM and the model, plus rules for who gets notified and what happens next. That is API integration and workflow automation work as much as data science.
Where B2B churn projects go wrong
- No agreed label. Sales says an account churned, finance says it downgraded.
- Leaky features. Signals recorded after the customer’s decision inflate test results.
- Too little data for the model chosen. A complex model on 300 accounts memorizes noise.
- No owner for the alerts. Scores go to a dashboard and nobody is accountable for acting.
- No feedback loop. Save plays are not logged, so the model cannot learn what works.
- Ignoring what is not recorded. Champion changes and budget cuts need a CRM field and a habit of filling it in.
Each of these is a readiness problem, not a modeling problem, and each can be checked before any model is built. Our AI readiness checklist walks through data, systems and ownership questions in the order a project meets them.
Perspective: why a tailored build beats a template
Churn is the use case where generic tooling disappoints most often. A template assumes a standard set of signals, but a freight customer, a construction client and a software account each show distress differently, and your contract terms, systems and renewal cycles are your own.
That is why we start with your workflows, not a model. The first question is what “churn” means in your contracts, and the second is where the evidence of it lives. Often the answer spans a CRM, a billing system and an operational platform that have never shared an account ID.
Our approach is tailored, industry-specific work aimed at tangible business change within 90 days, with every solution fitted to your workflows, systems and goals. For churn that means the score, the reason behind it and the alert in your team’s own tools, so the prediction turns into a call that gets made.
A model alone saves no accounts. A model connected to the people and processes who own renewals does.
Souhail
How Digital Fractal helps
If you want to know whether your data can support churn prediction, the AI Readiness Audit is where we begin. It identifies where AI and automation can pay off in your business and what stands between you and a working model. It is a one-off engagement priced from $2,500 to $10,000.
From there, we build the pieces a churn workflow needs: custom CRM systems and API integrations to bring your account data together, and workflow automation so a risk alert becomes a task, a message or an escalation without manual handoffs. Teams in Toronto, Vancouver, Calgary and across Canada can start from our AI consulting overview for Canada.
FAQ
How much data do I need to predict B2B churn?
There is no fixed minimum, but you need several years of renewals with known outcomes and enough churned accounts for patterns to show. With a few hundred accounts, use simple, interpretable models and validate on later periods. If your history is thin, start by improving what you record in the CRM and add predictions as the dataset grows.
Is churn prediction only for SaaS companies?
No. Any business with recurring or repeat accounts can use it, including logistics providers, equipment services and field operations. The signals differ: shipment volume, on-time performance, claims and service tickets stand in for logins and feature use. The method of labeling, feature building and validating is the same.
Which model should I start with?
Start with logistic regression or a decision tree, because both are easy to explain and work on small datasets. Move to gradient-boosted trees if the baseline leaves clear room to improve. Choose based on validation against later renewals, not on how advanced the method sounds.
How far ahead should the model predict?
Long enough for your team to act. Think of the length of your renewal conversation and the lead time of a save play, then set the window to cover both. Enterprise contracts generally need a longer window than short or monthly ones.
How long does it take to get a churn workflow running?
It depends on how ready your data and systems are, which is why we begin with an audit. Our projects are scoped around delivering business change within 90 days, and the audit shows what that would include for your accounts.
Sources
- The use of knowledge extraction in predicting customer churn in B2B (Journal of Big Data, 2021)
- Churn Prediction Methods Evaluation and Implementation (Simon Fraser University thesis, 2021)
- 10.2. Performance Metrics, Data Science for Managers
- Customer Churn Architecture with Fabric Real-Time Intelligence, Microsoft Learn