
Change Order Risk Analytics: Spot Costly Changes Early

Change order risk analytics means using your own project records to see which changes are likely to cost you money, time or a dispute before they are approved, not after they are billed. It joins three things most firms keep apart: the risk register, the change log and the cost and schedule data. We build this kind of tailored automation at Digital Fractal, and the pilot-first approach to construction change order automation is where most firms should start: one trade, one data feed, one approval gate, proven inside 90 days.
This guide is for operations and digital transformation leads at contractors, logistics and field-service firms, and for the developers who will wire analytics into an app. It covers what the analytics does, which data it needs, how to roll it out, how to measure it and what must stay with a person.
TL;DR
- Change order risk analytics scores proposed changes against contract terms, budget and history so problems surface at the proposal stage.
- The inputs are ones you already hold: contract values, rates, change logs, RFIs, daily logs, cost codes and schedule data.
- Categorizing past changes and predicting from category averages beats using one overall average, according to an Air Force Institute of Technology thesis.
- AI should flag and prioritize. A person sets the price and approves, because approval is authority the contract gives to people.
- Start with one high-overrun category and a 90-day pilot, then measure cycle time, leakage and surprise changes.
Table of Contents
- What change order risk analytics actually is
- Why prediction is hard, and why it is still worth doing
- The risks analytics can flag in a change order
- Which project data predicts change risk
- How to roll it out in 90 days
- What still needs a person
- Data and adoption challenges to plan for
- How to measure whether it works
- Perspective
- Where to start
- FAQ
- Sources
What change order risk analytics actually is
A change order is a signed amendment to the contract that changes scope, price or time. Risk analytics asks of each one: how likely is it to be wrong, late, duplicated or disputed, and what does it do to the forecast?
It helps to separate it from its neighbours:
- Risk management identifies and sizes events that could hit cost or schedule.
- Change management is what happens when one of those events occurs: the baseline is adjusted and the impact documented. AACE International’s guidance on change management within total cost management notes that it includes evaluating the risks of trends, deviations and proposed changes. It also notes that most change decisions are tactical and involve less rigorous analysis than a formal quantitative risk analysis.
- Change order risk analytics fills that gap. It gives the quick, tactical decision a data-backed risk reading without waiting for a full quantitative risk analysis.
The practical result is that a change lands as a priced, traceable item tied to the risk that caused it and the contingency it draws on, instead of a surprise the forecast must absorb later.
Why prediction is hard, and why it is still worth doing
A 2025 master’s thesis from Concordia University in Montreal points out that predictive models for change orders have received limited attention, and that predicting them early in a project’s life is difficult because many factors drive them, including specifications, spatial properties and the performance of the parties involved.
That is an argument for narrow, practical analytics rather than a grand forecasting model. You are not trying to predict every change. You are trying to rank the ones in front of you by risk and catch the expensive ones early.
The risks analytics can flag in a change order
The checks that pay off first are mechanical. They compare a proposed change against documents you already have:
| Flag | What the analytics compares | Why it matters |
|---|---|---|
| Work already in the base contract | Change description against drawings, specifications and the original scope | Prevents paying twice for included work |
| Duplicate delay and T&M billing | Claimed delay days against time-and-materials hours for the same period | Overlap inflates the claim |
| Markup above the contract cap | Markup percentage against the contract’s allowed maximum | A cap breach is a straight overcharge |
| Rate above the agreed schedule | Hourly or unit rates against the master agreement | Small rate gaps multiply across lines |
| Quantity-times-rate errors | Line math against stated totals | Arithmetic errors hide in long change orders |
| RFI answered as clarification, billed as a change | RFI responses against later change requests | Shows where scope was disputed in advance |
| Site activity with no signed change order | Daily logs, photos and timesheets against the change log | Work done without paper is work you may not be able to bill |
The last row is the most valuable. A Canadian construction consultancy writing about AI in this area, Treadstone Associates, calls flagging logged site activity that has no signed change order behind it the most valuable form of automation. We agree, and it needs no prediction at all: it is a join between two records.
Which project data predicts change risk
There are two layers of signal: early warning at the project level and pattern recognition at the change level.
Project-level warning signs
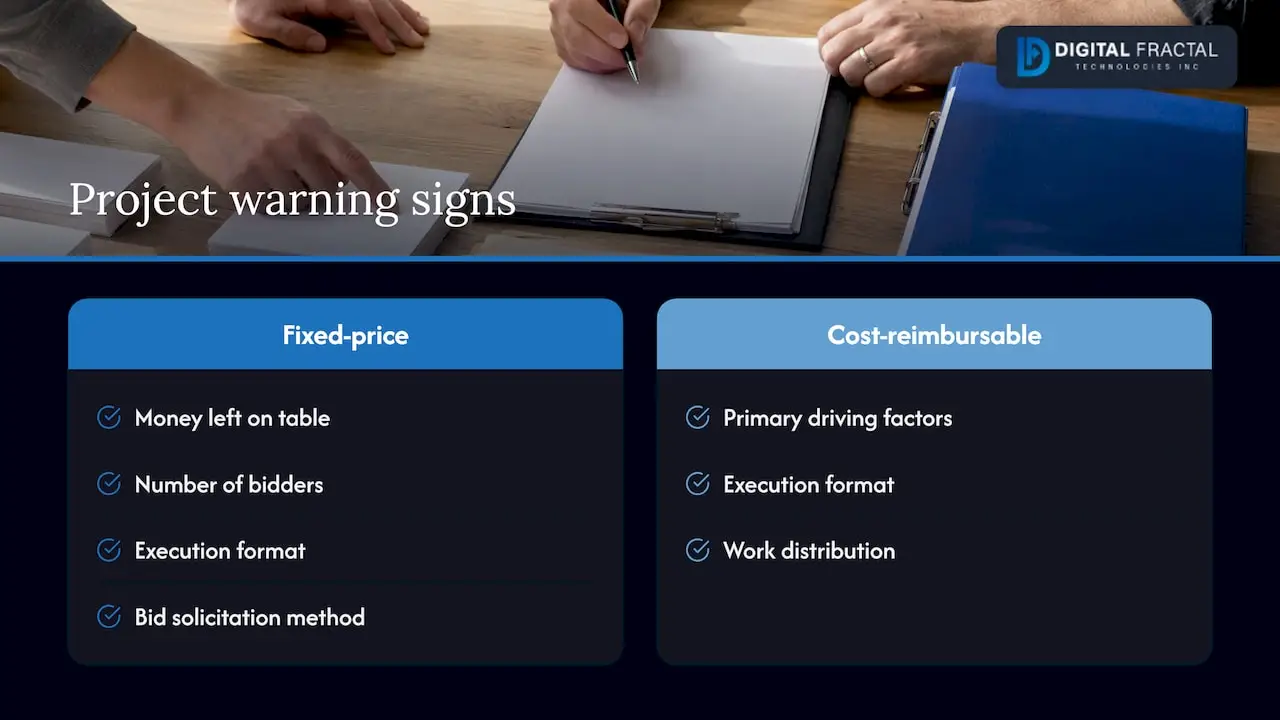
A Construction Industry Institute study of 106 projects with a combined original contract value of $3.9 billion looked at early warning signs of project changes. For fixed-price work, the signs included money left on the table, the number of bidders, execution format, how the bid was solicited and the type of owner. For cost-reimbursable work, they included the primary driving factors, execution format and work distribution. The study also found that cascading successive changes can substantially increase growth. The study dates from 1987, so treat it as the foundation for which fields to capture, not as a benchmark for your own numbers.
Change-level patterns
An Air Force Institute of Technology thesis analyzed historical change request forms with text mining and word-frequency analysis, sorting them into nine categories such as wastewater, electrical, concrete and multi-category requests. Multi-category requests proved significantly more expensive than single-category ones. Categorizing changes and applying confidence intervals per category predicted future cost and time impact more accurately than using the mean of the whole dataset.
For a contractor, that translates into a short list of fields worth structuring from day one:
- Change category and trade, using a controlled list rather than free text.
- Originator: owner, design team, field or subcontractor.
- Cost code and work package affected.
- Original contract value, committed cost and remaining budget at the time of the request.
- Schedule impact and whether the critical path is touched.
- Linked RFI, risk register entry and contingency line.
- Days from request to approval, and from approval to billing.
The point about structure matters. More data is not the goal. Consistent, well-labelled records on a few fields beat a large pile of free-text emails.
How to roll it out in 90 days
A full platform rollout invites delay. A narrow pilot produces evidence. This is the sequence we recommend.
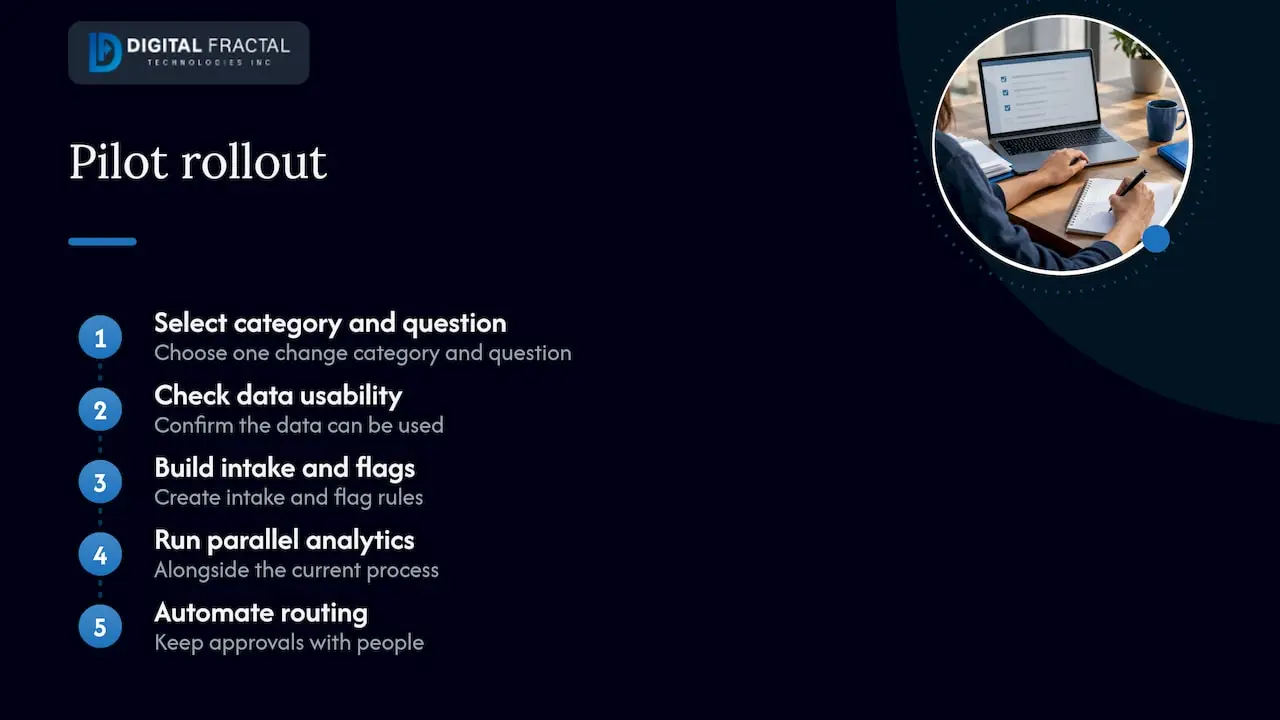
Step 1: Pick one category and one question
Choose the change category that has burned you most, for example electrical or civil scope changes, and one question to answer, such as “which of these have no signed change order behind them?” Narrow scope keeps the data work small.
Step 2: Check that the data is usable
Pull 12 to 24 months of change orders, contracts, rate schedules and logs. Check that identifiers match between systems, that cost codes are consistent and that changes can be tied to a project and a trade. Our guide to enterprise data readiness walks through how to assess exactly this, and an AI readiness audit is where we do it against your actual systems. The audit is a one-off engagement priced from $2,500 to $10,000.
Step 3: Build the intake and the flags
Intake means capturing change data wherever it arrives: email attachments, portal uploads, site photos, ERP entries. The flags are the rules and models from the table above. We design these around your own workflows, systems and contract terms rather than a generic template, which is how our approach differs from off-the-shelf consulting. Where your cost and procurement data lives in an ERP, see how we handled construction ERP software for an example of connecting those records.
Step 4: Run it beside the current process
For a month or two, let the analytics flag changes while your team keeps approving the way it does now. Compare what the flags caught with what people caught. Tune thresholds, for example flagging when cumulative changes on a work package pass a percentage you set, or when a change touches the critical path. If schedule exposure is your bigger worry, our piece on how to find, size and reduce construction schedule risk covers that side.
Step 5: Move routing to the system, keep sign-off with people
Once the flags are trusted, let the system route changes to the right approver by cost threshold, contract terms and schedule impact. Approval itself stays with the person the contract names. Workflow automation handles the routing, reminders and escalation so your project managers spend time on the decisions, not the chasing.
What still needs a person
Analytics supports the decision. It does not make it.
- Pricing. Rates, supplier costs and productivity assessments are your estimate. Treadstone’s guidance is that AI must not set the price.
- Approval. Approval is a person exercising authority given by the contract. Contracts that require wet signatures, and owner or lender conditions, must be respected by whatever workflow you automate.
- Contract interpretation. A flag that says “possibly already in scope” needs a person who knows the drawings and the contract to confirm it.
- Field judgment. An alert that a trade is trending toward a change is a prompt for a conversation with the superintendent, not a verdict.
Designed this way, the analytics shortens the time between a change appearing and a person deciding, and every decision carries its evidence with it.
Data and adoption challenges to plan for
Three problems come up repeatedly in this kind of project.
Scattered records. Change data sits in email, spreadsheets, a project management tool and the accounting system. Plan integration through APIs from the start. If you are a developer building this into an app, a clean change-order record schema and a stable API layer matter more than the model choice.
Inconsistent labelling. If one project calls a change “extra work” and another “CCN,” category-level prediction collapses. Agree a controlled vocabulary before training anything.
Adoption. Field staff log changes late when logging is a chore. Mobile capture with photos and a quick category pick makes the data better at the source. This is also where mobile app development and analytics meet: the app is the data-quality tool.
How to measure whether it works
Set baselines before the pilot starts, using the same 12 to 24 months of history. Then track a handful of measures:
- Approval cycle time: average days from change submission to final approval.
- Unbilled or unsigned work: value of site activity with no signed change order behind it.
- Flag accuracy: share of flags that a reviewer confirms as real issues, tracked during the parallel run.
- Surprise changes: changes that arrive with no linked risk or contingency line.
- Forecast movement: how far the cost forecast shifts when a change lands.
Review them monthly. A pilot that cuts cycle time and surfaces unsigned work in a single category has earned its expansion to the next trade.
Perspective
Most firms we speak with do not have a prediction problem. They have a visibility problem. The change is happening in the field, the paper is somewhere in an inbox, and the forecast hears about it weeks later.
That is why we start small. Our AI readiness audit looks at the records you already have and tells you which change categories can support analytics now. Then we build tailored automation around your workflows and systems, aimed at tangible results within 90 days. We do not offer generic consulting, because a change order flag that ignores your contract terms and cost codes is noise.
Our view is simple: keep the risk register and the change log talking to each other, let software do the comparing and the chasing, and keep the decision with the person who holds the authority. Teams that work this way spend their time on judgment instead of reassembling the story after the fact.
Souhail
Where to start
If you want to know whether your change data can carry analytics, begin with our AI Readiness Audit, a one-off engagement at $2,500 to $10,000. It identifies the automation opportunities in your operations and gives you a concrete plan. From there, our construction change order automation pilot turns it into working flags and routing.
For logistics and field-service firms, the same approach applies to change requests on routes, schedules and work orders. Our team in Edmonton, Alberta works with Canadian firms in construction, oil and gas and logistics.
FAQ
Is change order risk analytics the same as change order management?
No. Change order management is the process of requesting, pricing, approving and recording changes. Risk analytics sits on top of it and scores each change for cost, schedule and dispute exposure. It also links each change back to the risk and contingency behind it.
What data do I need to begin?
Start with 12 to 24 months of change orders, the related contracts and rate schedules, cost codes, RFIs and daily logs. The most important quality is consistency: matching project and trade identifiers and a controlled list of change categories. A readiness audit will show what is usable and what needs cleanup.
Can AI approve change orders?
It should not. Approval is a decision by a person with authority under the contract, and some contracts require wet signatures. AI is best used to flag issues, prioritize alerts, route items and summarize what is emerging, with a person signing off at each approval gate.
How long does a pilot take?
We aim for tangible results within 90 days. A pilot covers one change category, a parallel run beside your current process and a review of the measures above before you decide to expand.
Sources
- AACE International, Professional Guidance Document No. 02
- Construction Industry Institute, Early Warning Signs of Project Changes
- Air Force Institute of Technology, Construction Change Order Data as Inputs for a Programmatic Approach
- Concordia University, Change Orders Predictability in Construction Projects and Ways to Improve It
- Treadstone Associates, Change order management that avoids disputes