Drilling NPT Prediction: Data, Models and a First Step

Drilling NPT prediction works when three things line up: consistent event labels from your daily reports, rig sensor data at a fine time resolution, and a model aimed at one NPT category (stuck pipe, losses or equipment failure) rather than “NPT” as a whole. Published studies report classification accuracy around 90% on reported data and large NPT reductions when equipment failures are predicted ahead of time. The fastest route to those results is a narrow, 90-day pilot built on the data you already hold. We start that with an AI Readiness Audit, priced at $2,500–$10,000 one-off.
This guide is for operators, contractors and logistics-heavy field teams who want to know what is realistic before they commission anything.
TL;DR
- NPT is reported time that does not contribute to drilling the well. Its definition is company policy, so your labels decide how good any model can be.
- Prediction models learn from daily drilling reports, mud logs, tool data and real-time sensor streams. Better time resolution, lithology and consistent annotation improve results.
- A 2018 SPE case study reported about 90.7% accuracy classifying productive versus non-productive time. Equipment-focused programs have reported 50–70% fleet NPT reductions.
- Start with one failure mode and one data set, not a platform. A readiness audit tells you which one pays back first.
Table of Contents
- What counts as NPT, and why the definition matters for a model
- What data an NPT prediction model needs
- Which methods predict what
- Know where your NPT sits before you model it
- A Canadian example: equipment-side NPT
- How to start: a 90-day NPT prediction pilot
- Limits you should plan for
- Our perspective
- Where to go from here
- FAQ
- Sources
What counts as NPT, and why the definition matters for a model
A model can only predict what your records label. The IADC’s DDR Plus codebook, the common standard for daily drilling reports, describes NPT as reported time spent on activities that do not contribute to drilling the well. It adds that specific definitions are company policy, and that NPT is not the same thing as equipment repair, which has its own code (Code 8).
That has two consequences for prediction work:
- Two operators can report the same stoppage differently. A model trained on one company’s codes may not transfer to another’s.
- The standard itself moves. In the V2.0 revision released for comment in October 2019, non-productive time was moved from a Main Code to a Sub-Activity Code. If your history spans several coding schemes, expect to map them before training anything.
The main cause groups are familiar to any drilling team: wellbore problems (stuck pipe, lost circulation, instability, kicks), equipment failures (top drives, pumps, MWD and motors), logistics, weather and operational rework such as failed cement jobs or tests. Each group needs a different model and a different intervention, which is why a single “NPT score” rarely helps a rig crew.
What data an NPT prediction model needs
Three kinds of data show up in nearly every published approach.
1. Event history with root causes. Daily drilling reports, mud logs and tool data are the raw material. A service-company platform described in Drilling Contractor trains models on exactly these sources, combined with historical field, regulator, operator and rig data, to learn where stuck pipe, lost circulation and wellbore instability contribute to NPT.
2. Real-time sensor streams. A 2014 AADE paper describes calibrated torque-and-drag, hydraulic and thermodynamic models that build virtual-sensor baselines from WITSML, WITS0 or OPC streams. WITSML is the standard format rigs use to share well data. The deviation from the baseline is the early warning. The paper’s author stresses that early symptoms of stuck pipe, hole collapse, lost circulation and kicks sit in hookload, surface torque, standpipe pressure and pit levels, but are hard for a driller to see in the moment.
3. Context from offset wells. A 2025 paper on machine-learning drilling analytics integrates geomechanical parameters (weight on bit, RPM, mud weight, ROP, ECD, shale reactivity), stuck-pipe incidents and NPT logs from offset wells before training. The same paper cites an SPE figure that nearly 40% of drilling data remains underutilized.
What improves results most is not exotic. In the US Department of Energy-supported EDGE geothermal project, which modeled 100+ wells, the team found that finer temporal resolution, lithological data and consistent operational annotations substantially improved model performance.
Which methods predict what
Different questions need different models. This table summarizes what the published work covers.
| What you want to predict | Approach in the literature | Reported result |
|---|---|---|
| NPT type and productive vs. non-productive time from written reports | NLP and deep neural networks on unstructured daily reports (SPE 2018) | 90.7% accuracy for productive vs. non-productive, 89% for NPT type, 87.5% for drilling phase |
| Wellbore instability risk | Ensemble ML (gradient boosting, random forest) against linear regression, trained on offset data | Forecasts instability risk before it develops |
| Stuck pipe or tight hole in the next window | Automated time-series features from 2-hour rolling windows, time-series validation (Stanford, 2025) | Scored with ROC-AUC and Matthew’s Correlation Coefficient |
| Rate of penetration and schedule | Models trained on offset wells (AADE 2025) | 69–88% ROP accuracy, 48–77% schedule accuracy |
| Precursor events such as overpull | Case-based reasoning that compares current patterns with matched historical cases (AOG) | Early flags, for example of potential mud motor failure |
Two details deserve attention. First, the 90.7% figure comes from models trained on 30% of the data set and tested on the rest, across 2,000+ wells. It describes how well a model classifies what has already been written down, which is a different task from forecasting a stuck-pipe event hours ahead. Second, the Stanford team validated with time-series splits, meaning the model is always tested on later data than it trained on. That is the honest way to test a forecast, and it is what you should expect of any model built for your wells.
Know where your NPT sits before you model it
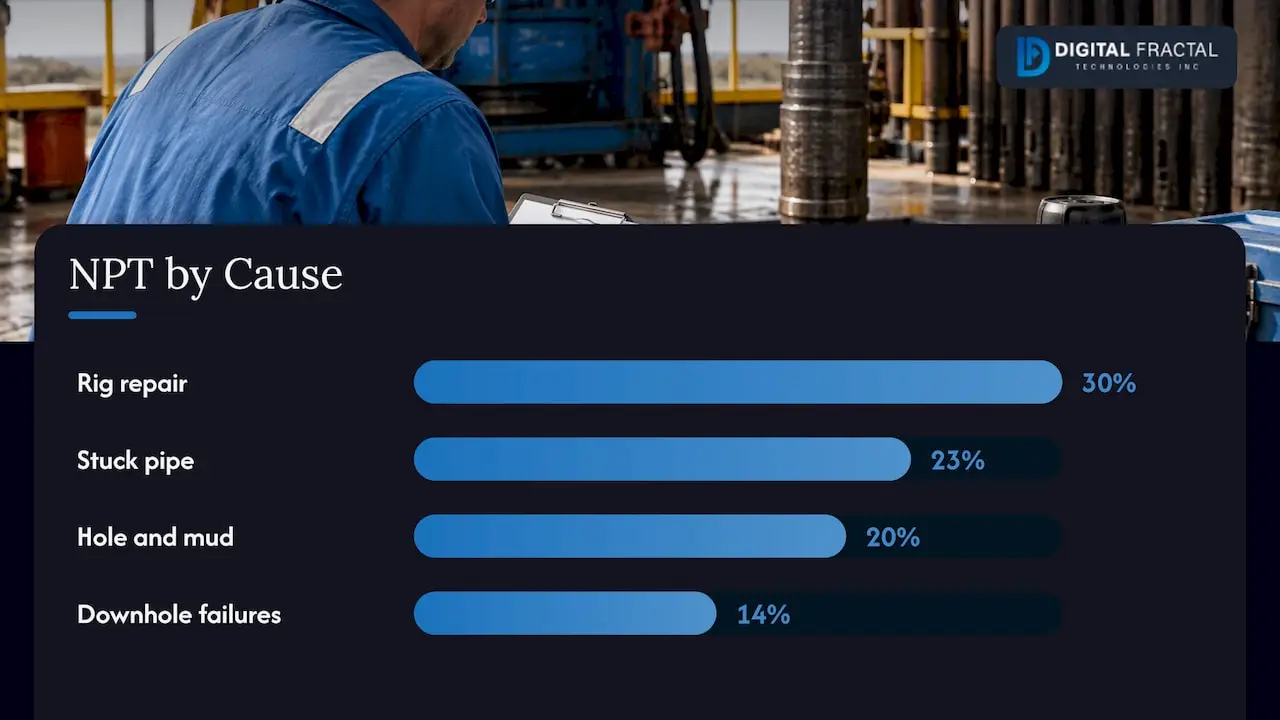
Prediction pays where NPT is concentrated. In the SPE case study’s 200+ well field example, the top NPT types were rig repair and maintenance (30%), stuck pipe (23%), hole and mud issues (20%) and downhole equipment failures (14%). Together that is 87% of the NPT in one field. Your split will differ, but the shape is typical: a few categories carry most of the lost time.
A quick worked exercise shows why this matters. Take your last 20 wells and sum the hours by cause code. If equipment failures lead, you are looking at a condition-monitoring problem on pumps and top drives. If stuck pipe and losses lead, you need a drilling-dynamics model fed by real-time surface data. Each is a different project with a different data source.
Also remember how cost works. Rig and spread costs accrue by the day, so NPT’s share of avoidable cost is usually larger than its share of well time. When NPT is removed, total elapsed time shrinks, so a new NPT percentage must be recalculated on the new, shorter well.
A Canadian example: equipment-side NPT
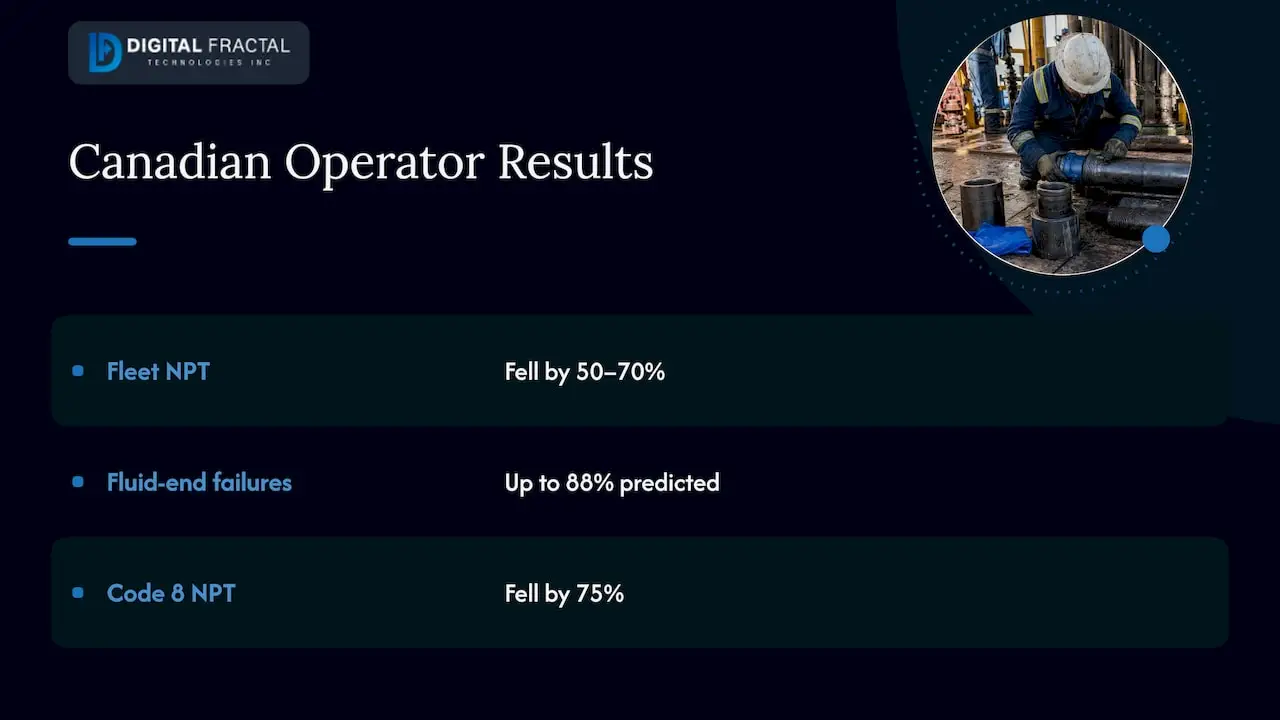
The strongest recent evidence comes from a Canadian rig operator. As Drilling Contractor reported in 2026, Precision Drilling has monitored mud pumps, top drives, engines, mud systems, catwalks and batteries on 120+ rigs in the US, Canada and the Middle East since January 2023. Fleet NPT fell by 50–70%. A model on 300+ mud pumps predicts up to 88% of fluid-end failures, and Code 8 NPT (equipment repair) fell by 75%.
The lesson for a smaller operator or contractor is the scope. This was not “AI for drilling.” It was condition data on specific components, a failure to predict, and a maintenance action attached to each prediction. We cover the same pattern in our write-up on AI predictive maintenance in Alberta, and the broader maintenance economics in a predictive maintenance strategy that pays back in months.
How to start: a 90-day NPT prediction pilot
This is the routine we recommend for a team that has history but no model yet.
- Pick one failure mode. Choose the NPT category with the most hours and the clearest sensor signature. Mud pump fluid ends and top drive faults are easier than “hole problems” because the signals are tied to a single component.
- Audit the labels. Check that report codes are applied the same way across rigs, crews and years. Published work keeps returning to this point: NPT totals are only as good as the codes behind them. Fixing the labels often takes longer than building the model.
- Inventory the data. List daily reports, mud logs, tool data and sensor streams, along with their time resolution and gaps. Note which streams arrive over WITSML or OPC and which sit in spreadsheets.
- Build a baseline with a time-based split. Train on earlier wells and test on later ones. Compare against a simple benchmark so you can see what the model adds.
- Attach an action to every alert. A prediction that does not change a decision, such as a pump swap, a mud adjustment or a tripping plan, only adds noise. Decide who receives the alert and what they do before going live.
- Pilot on a few assets, then widen. Expand once the alerts have proven useful to the crews who receive them.
At step 3, most teams discover that their data is spread across systems that were never meant to talk to each other. That is where the audit does its work: we use the AI Readiness Audit to identify where automation and prediction will pay off, so the pilot starts from a ranked list rather than a guess. Where reports, maintenance records and field systems need connecting, our workflow automation and API integration services cover that work.
Limits you should plan for
The EDGE team found that predictive accuracy varied across heterogeneous datasets. Models built on one basin or one operator’s conventions need re-validation when they meet a new set of wells. The same team concludes that moving from advisory analytics toward semi-autonomous drilling depends on expanded datasets and field validation.
In practice that means three planning rules. Budget time for data cleaning. Treat the first model as an advisory tool that a driller or engineer can accept or overrule. And measure the result in hours of NPT avoided on the pilot assets, not in model accuracy alone.
Our perspective
Most of the NPT conversations we hear start with a platform. We think they should start with a single question: which failure costs you the most days, and what data do you already have on it?
The published results point the same way. The big reductions come from narrow targets, such as a component with a known failure pattern, a clean label and an action attached to each alert. Generic dashboards do not produce them.
That is why we do not offer off-the-shelf consulting. Our solutions are tailored to a client’s own workflows, systems and goals, and we aim for tangible results within 90 days. For an operator, that means a pilot around one cause code, built on your reports and your sensor feeds, rather than a wide program that takes years to show anything.
Our AI readiness audit is where we begin. It shows where your data and processes are ready for prediction, and where they need work first.
Souhail
Where to go from here
If you run field operations in Canada and want to know whether your reports and sensor data can support NPT prediction, the AI Readiness Audit is the place to begin. It is a one-off engagement priced from $2,500 to $10,000, and it identifies the automation and prediction opportunities in your operation. Implementation then follows through our AI consulting and machine learning solutions.
For logistics-heavy operations that need real-time visibility on trucks, equipment and field assets, the same pilot-first method applies, as set out in our predictive maintenance for logistics playbook.
FAQ
What is NPT in drilling?
NPT is non-productive time: reported time on activities that do not contribute to drilling the well, such as fishing, curing losses, waiting and unplanned repairs. The exact definition is set by each company’s policy, and equipment repair is coded separately in the IADC standard. Check your own definitions before you train a model on the labels.
How accurate is drilling NPT prediction?
It depends on the task. A 2018 SPE case study reported 90.7% accuracy classifying productive versus non-productive time and 89% for NPT type. Forecasting rate of penetration from offset wells reached 69–88% in a 2025 AADE paper. A time-based split is the fair test of any forecast.
What data do I need?
Start with daily drilling reports that carry consistent NPT codes and root causes, mud logs, tool data and real-time sensor streams such as hookload, torque and standpipe pressure. Finer time resolution, lithology and consistent annotations improve results.
Can a smaller operator or contractor do this?
Yes, if the scope is narrow. One failure mode, one data set and a defined action per alert is a workable 90-day pilot. An AI readiness audit helps you choose which one to start with.
Does NPT prediction work for equipment failures?
The strongest evidence is there. A Canadian rig operator reported a 75% cut in equipment-repair NPT after predicting mud pump fluid-end failures, with up to 88% of failures predicted on 300+ pumps.
Sources
- IADC DDR Plus main code definitions (2019)
- IADC: DDR Plus V2.0 released for final comment
- Drilling Contractor: Industry seeks new ways to unlock data and drive optimization
- AADE: Detection and Prevention of Drilling Problems through Real-Time Modeling
- From Reactive to Proactive: Machine Learning-Powered Drilling Analytics (2025)
- OSTI: Toward Drilling the Perfect Geothermal Well
- SPE 2018: Applications of Machine Learning and Data Mining in drilling
- Stanford Pangea: Automated time series feature engineering (2025)
- AADE 2025 NTCE paper on predictive drilling models
- AOG: Predictive Analytics Technology Boosts Efficiency, Reduces NPT
- Drilling Contractor: Precision reduces equipment cost of ownership through AI-driven component life optimization