
Spare Parts Forecasting: Methods, Data and AI That Work

Spare parts forecasting is the practice of estimating which parts you will need, how many, and when. It is hard because demand is irregular: long stretches with no orders, then a sudden spike when a machine fails. The approach that holds up is to forecast from the equipment that generates the demand (its age, usage, failure behaviour and maintenance plan), pick a method that matches each part’s demand pattern, and measure the result against service levels and inventory cost, not forecast error alone.
TL;DR
- Spare parts demand is intermittent and lumpy, so standard averages and simple smoothing mislead. Match the method to the demand pattern of each part.
- Demand comes from machines in service. Installed base, age, usage, failure rates and maintenance schedules usually beat sales history alone.
- AI and machine learning can help, especially when you add operational data such as usage or flight hours, but only when your data is linked and clean.
- Track forecast error together with fill rate, stockouts, inventory carrying cost, turns and days of supply.
- Start with a pilot on a limited set of critical parts, then expand once the data model is validated.
Table of Contents
- Why spare parts demand is so hard to forecast
- Start with the installed base, not just sales history
- Choosing a forecasting method by demand pattern
- Where AI and real-time data help
- Build the data foundation first
- Measuring forecast accuracy and business impact
- A pilot-first implementation plan
- Our perspective
- How Digital Fractal can help
- FAQ
- Sources
Why spare parts demand is so hard to forecast
A conveyor motor, a hydraulic seal or a brake sensor might be ordered twice a year. Most weeks the demand is zero. Researchers describe this pattern as intermittent: many periods have no demand at all, and when demand does arrive its size can be low, variable or clumped, which produces what planners call lumpy demand.
Three features make the problem harder than forecasting finished goods:
- Two kinds of demand. The same research explains that preventive maintenance creates scheduled demand of uncertain size, while corrective maintenance creates demand at a random time, usually for a single unit. Blending the two in one time series hides both.
- History is often not enough. A review of installed base information notes that historical data alone is often insufficient because demand is erratic and intermittent, parts can be expensive, shortages costly and obsolescence a real risk.
- Scale and life cycle. The same review points out that demand follows product life-cycle phases and local factors, and firms may manage thousands of distinct parts. Nobody tunes thousands of forecasts by hand.
For a logistics fleet, a construction contractor or an oil and gas operator in Canada, add long supplier lead times, remote sites and winter conditions. A missing part does not just cost the part. It idles a truck, a crew or a compressor.
Start with the installed base, not just sales history
The most useful shift in spare parts planning is to forecast from the equipment, not from past orders. A 2019 review of installed-base approaches explains that the number of machines that can generate demand, along with their age and usage, supports both forecasting and inventory decisions. Demand originates from machines in service, so a forecast that ignores the fleet is guessing.
The same review lists the data that makes this work: shipments, field and depot usage, part and product returns, product population, sales forecasts, retirements and part failure rates.
In practice, a first pass looks like this:
- Count the population. How many units of each asset type are active, and how old are they?
- Attach parts to assets. Build a bill of materials that links each part number to the equipment that consumes it.
- Estimate failure behaviour. Use work-order history, manufacturer guidance and technician knowledge to estimate how often each part fails or is replaced at a given age or usage level.
- Layer in the maintenance plan. Planned replacements are the most predictable demand you have. Pull them from your preventive maintenance schedule instead of letting them show up as surprises.
- Forecast the remainder. Apply a statistical or machine learning model only to the demand that planning cannot explain.
The authors of the 2011 study make the same argument: forecasts should model the maintenance processes that generate demand, not just react to the observed time series. If you run predictive maintenance, you already hold some of the best forecasting inputs available. Our guide to a predictive maintenance strategy that pays back in months shows how condition data turns into planned work, and planned work turns into parts you can order before the failure.
Choosing a forecasting method by demand pattern
No single method fits every part. A sensible set of rules:
| Demand pattern | Typical example | Approach to consider |
|---|---|---|
| Steady, frequent demand | Filters, belts, consumables | Standard time-series models with seasonality |
| Intermittent, stable | Bearings, seals, valves | Croston-type methods and their bias-corrected variants |
| Intermittent, fading | Parts for ageing or discontinued models | Methods that let the demand probability decay toward zero |
| Driven by schedules | Planned overhaul kits | Maintenance-plan-based calculation |
| Driven by usage or condition | Engine, drivetrain or hydraulic components | Machine learning with usage and sensor features |
The academic literature has long compared statistical techniques such as ARIMA and Croston’s method against alternatives, and a widely cited evaluation of forecasting methods for spare parts concludes that results depend on the data and on how much equipment information you include. Treat any “best algorithm” claim with suspicion until it has been tested on your own parts.
Classify before you forecast
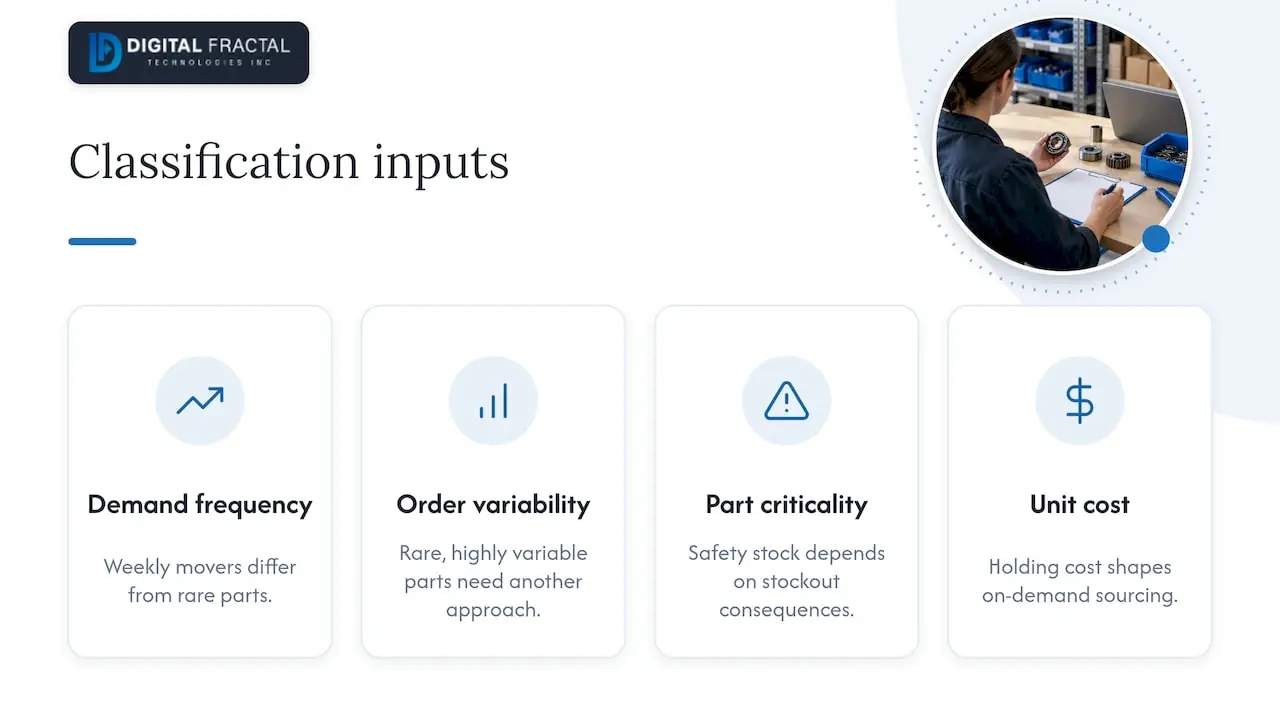
Before choosing a model, sort your parts into groups using two simple measures: how often demand occurs, and how variable the order size is when it does. Parts that rarely move and vary a lot need a different approach from parts that move weekly. Add two business overlays: criticality (what happens if you run out) and unit cost (what it costs to hold one). A cheap, critical part gets a generous safety stock. An expensive, low-criticality part may be better sourced on demand or shared across sites.
What the Canadian research shows
Several recent Canadian studies are worth knowing about:
- A 2024 master’s thesis from Polytechnique Montréal built an AI-based spare parts demand prediction model for an industrial partner using ERP maintenance data and reported up to a 69% reduction in mean absolute error compared with traditional literature-based practices.
- A 2023 Concordia University thesis using real-world data from an aviation company found that deep learning models, especially Gated CNN and LSTM, on average outperformed other models for intermittent demand.
- A Bombardier study reports that combining model outputs and features, including flight-data features, improves forecast robustness and accuracy across different demand patterns.
These results come from specific datasets, so use them as evidence that the approach is worth piloting, not as a promise about your numbers.
Where AI and real-time data help
AI earns its place in spare parts forecasting in three situations.
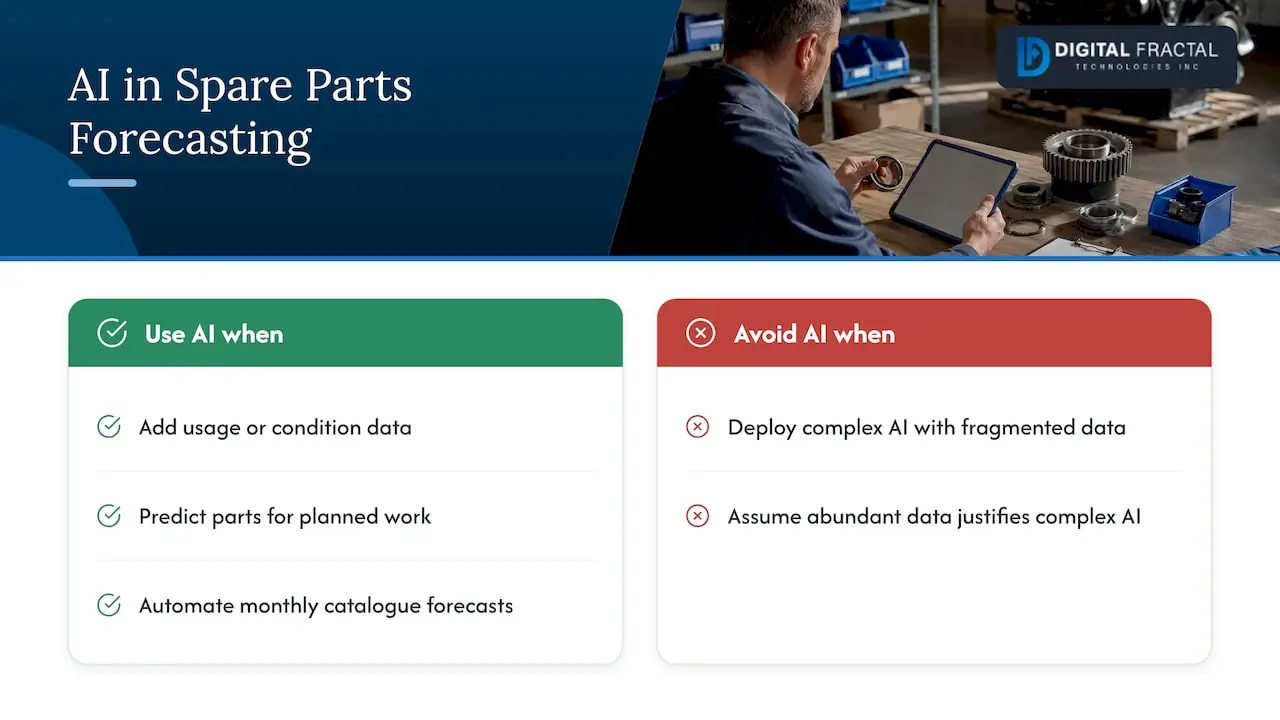
1. You have usage or condition data that statistics ignore. A time-series model sees only past orders. A machine learning model can also see engine hours, kilometres driven, vibration readings, duty cycle or weather exposure. The Bombardier work above is the clearest example: the strength of the approach is the added operational features.
2. You need part recommendations for planned work. In aviation maintenance, Bombardier says its AI-driven parts recommendation models have proven 85% accurate in predicting the parts needed for specific inspections, as reported in May 2025. The same idea applies to a truck service, a crane inspection or a compressor overhaul: predict the kit before the technician opens the machine.
3. You manage a very large catalogue. When thousands of part numbers need monthly forecasts, automation is the only way to keep them current.
AI is not always the right answer. Academic researchers in aviation supply chain management argue that model complexity should match management readiness, and that abundant data does not justify complex AI if coordination and data integration are fragmented. If your work orders live in one system, your inventory in another and your purchasing history in a spreadsheet, fixing that comes first.
Build the data foundation first
A 2025 case-study paper on spare parts data models found that linking spare parts data with maintenance, logistics, equipment and inventory data in one coherent database reduced data-gathering effort. One case in that study reported a 15.1% stock-value reduction and a 76 to 91% improvement in full-time-equivalent resources. Those are results from one organization, not a benchmark, but they show where the early gains tend to come from: less time spent assembling data and fewer parts held without a reason.
A practical data checklist:
- Consistent part numbers across the maintenance system, inventory system and purchasing records
- Work orders that record the part used, the asset, the date and the failure reason
- Asset register with install dates, location and usage meters
- Supplier lead times, both quoted and actual
- Returns, repairs and scrap records
- Stockout events, including expedited orders and workarounds
If you want an outside view of how ready your data is, our guide to enterprise data readiness walks through what to assess. For a broader view of stock policy once you have a forecast, see our AI inventory optimization guide for supply chain managers.
Measuring forecast accuracy and business impact
Forecast error on its own can mislead. A model can reduce error on slow-moving parts and still leave you short on the one part that stops a line. Measure at several levels.
APQC recommends tracking forecast error using MAPE at national, product-family and shipping-location levels, alongside fill rates, stockout impact, inventory carrying cost, turns and days of supply. For spare parts, a workable scorecard looks like this:
| Measure | What it tells you | Review rhythm |
|---|---|---|
| Forecast error (MAPE or similar), by part class | Whether the model is improving over your baseline | Monthly |
| Fill rate for critical parts | How often the part was on the shelf when needed | Monthly |
| Stockout events and their downtime cost | The real price of a miss | Per event, summarized quarterly |
| Inventory carrying cost and turns | The price of the safety you hold | Quarterly |
| Days of supply by criticality tier | Whether stock matches risk | Quarterly |
Keep a baseline. Before you change anything, record your current fill rate, stockouts and inventory value for the pilot parts. Without it, you cannot say what the new forecast achieved. In the 2025 case study, company experts and cross-checks against the maintenance management system validated the model continuously. Copy that habit: let planners and technicians challenge the output every cycle.
A pilot-first implementation plan
A full rollout across every site and every part is where these projects stall. A pilot keeps risk low and proves value quickly.
- Pick the scope. Choose one asset class or one site and 50 to 200 parts. Include a mix of critical, expensive and fast-moving items.
- Set the baseline. Record current service level, stockouts, expedite costs and inventory value.
- Link the data. Join work orders, asset records, inventory and purchasing for the pilot scope.
- Segment and forecast. Classify parts by demand pattern and apply the matching method. Add usage or condition features where you have them.
- Run in shadow mode. For one or two cycles, compare the new forecast with what planners would have ordered. Do not change purchasing yet.
- Go live with review. Let the forecast drive replenishment proposals, with planners approving them.
- Measure and expand. Compare results with the baseline, then add more parts and sites.
The same logic carries over to specific industries. For fleets and warehouses, see our pilot-first playbook for predictive maintenance in logistics. For contractors with mixed equipment, the predictive maintenance asset pilot for construction shows how a small pilot can be structured. For operators in the energy sector, our piece on AI predictive maintenance in Alberta covers trends in the region.
Our perspective
Most spare parts problems we see are not forecasting problems at first. They are connection problems. The maintenance system knows what failed, the inventory system knows what is on the shelf, and the purchasing team knows what the supplier promised. Nobody sees all three at the same time.
That is why we do not start with a model. We start by mapping the workflows and systems the forecast depends on, then we choose the lightest approach that works for your parts. Sometimes that is a maintenance-plan calculation and a cleaned-up reorder rule. Sometimes it is a machine learning model fed by usage data. Our approach is tailored to your workflows, systems and goals, not a generic template, and we aim to show tangible results within 90 days.
If a part is critical, the forecast should reach the planner as a clear proposal they can approve, not as a dashboard they have to interpret. Automating the repetitive steps around the forecast (pulling data, flagging risks, drafting replenishment proposals) is where teams usually get their time back.
Souhail
How Digital Fractal can help
If you manage spare parts for a logistics fleet, a construction business or an oil and gas operation, the quickest way to find out whether better forecasting is within reach is our AI Readiness Audit. It reviews your data, systems and workflows and identifies where automation and AI can pay off. It is a one-off engagement priced from $2,500 to $10,000, and it often leads into implementation.

See the details on the AI Readiness Audit page. If you already know where the pain is, we can also build the surrounding automation, from data pulls to replenishment proposals, through our workflow automation service, or discuss a tailored build on our AI and machine learning solutions page.
FAQ
What is the best method for forecasting intermittent spare parts demand?
There is no single best method. Croston-type methods are the usual starting point for stable intermittent demand, while parts nearing obsolescence need methods that let the forecast fall toward zero. Where you have usage or condition data, machine learning can add value. Test candidates against your own parts and your own baseline.
What data do I need to forecast spare parts demand?
At minimum, you need part usage history, the asset register, failure or replacement records and supplier lead times. Research on installed-base forecasting also points to product population, returns, retirements and failure rates as useful inputs. The more cleanly these link to each other, the better the forecast.
Can AI improve spare parts forecasting?
It can, particularly when you add operational data that time-series methods cannot see. Canadian research, including the Polytechnique Montréal thesis, reports sizeable error reductions on specific datasets. Results depend on your data quality, so run a pilot before committing to a full rollout.
How do I know if my forecast is working?
Compare it with a baseline you recorded before the change. Track forecast error alongside fill rate, stockouts, inventory carrying cost and days of supply. If error improves but critical-part stockouts do not fall, the model is solving the wrong problem.
How long does it take to see results?
A scoped pilot on a limited set of parts can show whether the approach works within a few planning cycles. Our engagements are designed to deliver tangible results within 90 days, but your timeline depends on how ready your data and systems are.
Sources
- Spare parts demand: Linking forecasting to equipment maintenance (2011)
- Forecasting spare part demand with installed base information (2019)
- On the use of installed base information for spare parts logistics (2010)
- Polytechnique Montréal thesis on maintenance data valorisation (2024)
- Concordia University thesis on intermittent demand with deep learning (2023)
- Bombardier Aftermarket Demand Forecast with Machine Learning (2023)
- Bombardier: The Epitome of Service Made Easy, AvBuyer (2025)
- AI Technology Portfolio Framework for Demand Forecasting (2026)
- An Empirical Data Model for Spare Parts Management (2025)
- How Can Inventory and Demand Planning Be Measured and Improved, APQC